Demographics of Europe
From Wikipedia, the free encyclopedia
Figures for the population of Europe vary according to the particular definition of Europe's boundaries. In 2018, Europe had a total population of over 745 million people.[1][2] Around 448 million of them lived in the European Union and around 110 million in European Russia; Russia is the most populous country in Europe.
.svg)

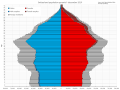
Europe's population growth is low, and its median age high. Most of Europe is in a mode of sub-replacement fertility, which means that each new(-born) generation is less populous than the one before.[3] Nonetheless, most West European countries still have growing populations, mainly due to immigration within Europe and from outside Europe and some due to increases in life expectancy and population momentum. Some current and past factors in European demography have included emigration, ethnic relations, economic immigration, a declining birth rate and an ageing population.
History
Prehistory
Approximately 5,000–130,000 people lived in Europe during the Last Glacial Maximum about 20,000 years ago.[4][5]
According to Volker Heyd, an archaeologist at the University of Helsinki, up to 7 million people lived in Neolithic Europe in 3000 BC.[6]
According to archaeologist Johannes Müller, the European population was about 1 million around 6500 BC, but increased to 8 million in 2000 BC.[7]
The following table shows estimates of historical population sizes of Europe (including Central Asia, listed under "former USSR") based on Maddison (2007),[8] in millions, with an estimated percentage of world population:
| Year | Population (millions) | Percentage of world total |
|---|---|---|
| AD 1 | 34 | 15% |
| 1000 | 40 | 15% |
| 1500 | 78 | 18% |
| 1600 | 112 | 20% |
| 1700 | 127 | 21% |
| 1820 | 224 | 21% |
| 1913 | 498 | 28% |
| 2000 | 742 | 13% |
Past populations of Europe in modern national borders, AD 1–2020
| Country/region | 1 | 1000 | 1500 | 1600 | 1700 | 1820 | 1870 | 1913 | 1950 | 1973 | 1998 | 2020 |
|---|---|---|---|---|---|---|---|---|---|---|---|---|
| Austria | 500[9] | 705[9] | 2000[9] | 2500[9] | 2500[9] | 3369[9] | 4520[9] | 6767[9] | 6935[9] | 7586[9] | 8078[9] | 8901[9] |
| Belgium | 300[9] | 400[9] | 1400[9] | 1600[9] | 2000[9] | 3424[9] | 5096[9] | 7666[9] | 8640[9] | 9738[9] | 10197[9] | 11493[9] |
| Denmark | 180[9] | 360[9] | 600[9] | 650[9] | 700[9] | 1155[9] | 1888[9] | 2983[9] | 4269[9] | 5022[9] | 5303[9] | 5823[9] |
| Finland | 20[9] | 40[9] | 300[9] | 400[9] | 400[9] | 1169[9] | 1754[9] | 3027[9] | 4009[9] | 4666[9] | 5153[9] | 5536[9] |
| France | 5000[9] | 6500[9] | 15000[9] | 18500[9] | 21471[9] | 31246[9] | 38440[9] | 41463[9] | 41836[9] | 52118[9] | 58805[9] | 67287[9] |
| Germany | 3000[9] | 3500[9] | 12000[9] | 16000[9] | 15000[9] | 24905[9] | 39231[9] | 65058[9] | 68371[9] | 78956[9] | 82029[9] | 83191[9] |
| Italy | 7000[9] | 5000[9] | 10500[9] | 13100[9] | 13300[9] | 20176[9] | 27888[9] | 37248[9] | 47105[9] | 54751[9] | 57592[9] | 59258[9] |
| Netherlands | 200[9] | 300[9] | 950[9] | 1500[9] | 1900[9] | 2355[9] | 3615[9] | 6164[9] | 10114[9] | 13438[9] | 15700[9] | 17425[9] |
| Norway | 100[9] | 200[9] | 300[9] | 400[9] | 500[9] | 970[9] | 1735[9] | 2447[9] | 3265[9] | 3961[9] | 4432[9] | 5368[9] |
| Sweden | 200[9] | 400[9] | 550[9] | 760[9] | 1260[9] | 2585[9] | 4164[9] | 5621[9] | 7015[9] | 8137[9] | 8851[9] | 10379[9] |
| Switzerland | 300[9] | 300[9] | 650[9] | 1000[9] | 1200[9] | 1829[9] | 2664[9] | 3864[9] | 4694[9] | 6441[9] | 7130[9] | 8667[9] |
| United Kingdom | 800[9] | 2000[9] | 3942[9] | 6170[9] | 8565[9] | 21226[9] | 31393[9] | 45649[9] | 50363[9] | 56223[9] | 59237[9] | 67886[9] |
| Portugal | 500[9] | 600[9] | 1000[9] | 1100[9] | 2000[9] | 3297[9] | 4353[9] | 6004[9] | 8512[9] | 8634[9] | 9968[9] | 10305[9] |
| Spain | 4500[9] | 4000[9] | 6800[9] | 8240[9] | 8770[9] | 12203[9] | 16201[9] | 20263[9] | 27868[9] | 34810[9] | 39371[9] | 48692[9] |
| Greece | 2000[9] | 1000[9] | 1000[9] | 1500[9] | 1500[9] | 2312[9] | 7554[9] | 8929[9] | 10835[9] | 10689[9] | ||
| 13 small countries | 100[9] | 113[9] | 276[9] | 358[9] | 394[9] | 657[9] | ||||||
| Total Western Europe | 24700[9] | 25413[9] | 57268[9] | 73778[9] | 81460[9] | 132888[9] | 187532[9] | 261007[9] | 305060[9] | 358390[9] | 388399[9] | 419639[9] |
| Albania | 200[9] | 200[9] | 200[9] | 200[9] | 300[9] | 437 | 1215[9] | 2296[9] | 3108[9] | 2878[9] | ||
| Bulgaria | 500[9] | 800[9] | 800[9] | 1250[9] | 1250[9] | 2187[9] | 4200[9] | 7251[9] | 8621[9] | 8257[9] | 6917[9] | |
| Czechoslovakia | 1000[9] | 1250[9] | 3000[9] | 4500[9] | 4500[9] | 7190[9] | 12393[9] | 14563[9] | 15686[9] | 16366[9] | ||
| - Czech Rep. | 10221[9] | 8930[9] | 10295[9] | 10702[9] | ||||||||
| - Slovakia | 3463[9] | 4642[9] | 5391[9] | 5460[9] | ||||||||
| Hungary | 300[9] | 500[9] | 1250[9] | 1250[9] | 1500[9] | 4571[9] | 9338[9] | 10432[9] | 10237[9] | 9770[9] | ||
| Poland | 450[9] | 1200[9] | 4000[9] | 5000[9] | 6000[9] | 10426[9] | 25753[9] | 33363[9] | 38666[9] | 38268[9] | ||
| Romania | 800[9] | 800[9] | 2000[9] | 2000[9] | 2500[9] | 6389[9] | 7360[9] | 16311[9] | 20828[9] | 22503[9] | 19266[9] | |
| Yugoslavia | 1500[9] | 1750[9] | 2250[9] | 2750[9] | 2750[9] | 5215[9] | 16578[9] | 21088[9] | ||||
| Eastern Europe | 4750[9] | 6500[9] | 13500[9] | 16950[9] | 18800[9] | 36415[9] | 52182[9] | 79604[9] | 139428[9] | 173037[9] | 164513[9] | 151529[9] |
| Former USSR | 3900[9] | 7100[9] | 16950[9] | 20700[9] | 26550[9] | 54765[9] | 88672[9] | 156192[9] | 180050[9] | 249748[9] | 290866[9] | 299173[9] |
| - Russia | 102833[9] | 132434[9] | 147671[9] | 146171[9] | ||||||||
| - Ukraine | 31142[9] | 36905[9] | 48274[9] | 50370[9] | 41902[9] | |||||||
| World | 230820[9] | 268273[9] | 437818[9] | 555828[9] | 603410[9] | 1041092[9] | 1270014[9] | 1791020[9] | 2524531[9] | 3913482[9] | 5907680[9] | 7800000[9] |
| Country/region | 1 | 1000 | 1500 | 1600 | 1700 | 1820 | 1870 | 1913 | 1950 | 1973 | 1998 | 2018 |
|---|---|---|---|---|---|---|---|---|---|---|---|---|
| Austria | 0.2[9] | 0.3[9] | 0.5[9] | 0.4[9] | 0.4[9] | 0.3[9] | 0.4[9] | 0.4[9] | 0.3[9] | 0.2[9] | 0.1[9] | |
| Belgium | 0.1[9] | 0.1[9] | 0.3[9] | 0.3[9] | 0.3[9] | 0.3[9] | 0.4[9] | 0.4[9] | 0.3[9] | 0.2[9] | 0.2[9] | |
| Denmark | 0.1[9] | 0.1[9] | 0.1[9] | 0.1[9] | 0.1[9] | 0.1[9] | 0.1[9] | 0.2[9] | 0.2[9] | 0.1[9] | 0.1[9] | |
| Finland | 0.0[9] | 0.0[9] | 0.1[9] | 0.1[9] | 0.1[9] | 0.1[9] | 0.1[9] | 0.2[9] | 0.2[9] | 0.1[9] | 0.1[9] | |
| France | 2.2[9] | 2.4[9] | 3.4[9] | 3.3[9] | 3.6[9] | 3.0[9] | 3.0[9] | 2.3[9] | 1.7[9] | 1.3[9] | 1.0[9] | |
| Germany | 1.3[9] | 1.3[9] | 2.7[9] | 2.9[9] | 2.5[9] | 2.4[9] | 3.1[9] | 3.6[9] | 2.7[9] | 2.0[9] | 1.4[9] | |
| Italy | 3.0[9] | 1.9[9] | 2.4[9] | 2.4[9] | 2.2[9] | 1.9[9] | 2.2[9] | 2.1[9] | 1.9[9] | 1.4[9] | 1.0[9] | |
| Netherlands | 0.1[9] | 0.1[9] | 0.2[9] | 0.3[9] | 0.3[9] | 0.2[9] | 0.3[9] | 0.3[9] | 0.4[9] | 0.3[9] | 0.3[9] | |
| Norway | 0.0[9] | 0.1[9] | 0.1[9] | 0.1[9] | 0.1[9] | 0.1[9] | 0.1[9] | 0.1[9] | 0.1[9] | 0.1[9] | 0.1[9] | |
| Sweden | 0.1[9] | 0.1[9] | 0.1[9] | 0.1[9] | 0.2[9] | 0.2[9] | 0.3[9] | 0.3[9] | 0.3[9] | 0.2[9] | 0.1[9] | |
| Switzerland | 0.1[9] | 0.1[9] | 0.1[9] | 0.2[9] | 0.2[9] | 0.2[9] | 0.2[9] | 0.2[9] | 0.2[9] | 0.2[9] | 0.1[9] | |
| United Kingdom | 0.3[9] | 0.7[9] | 0.9[9] | 1.1[9] | 1.4[9] | 2.0[9] | 2.5[9] | 2.5[9] | 2.0[9] | 1.4[9] | 1.0[9] | |
| Portugal | 0.2[9] | 0.2[9] | 0.2[9] | 0.2[9] | 0.3[9] | 0.3[9] | 0.3[9] | 0.3[9] | 0.3[9] | 0.2[9] | 0.2[9] | |
| Spain | 1.9[9] | 1.5[9] | 1.6[9] | 1.5[9] | 1.5[9] | 1.2[9] | 1.3[9] | 1.1[9] | 1.1[9] | 0.9[9] | 0.7[9] | |
| Other | 0.9[9] | 0.4[9] | 0.3[9] | 0.3[9] | 0.3[9] | 0.3[9] | 0.4[9] | 0.4[9] | 0.5[9] | 0.4[9] | 0.3[9] | |
| Total Western Europe | 10.7[9] | 9.5[9] | 13.1[9] | 13.3[9] | 13.5[9] | 12.8[9] | 14.8[9] | 14.6[9] | 12.1[9] | 9.2[9] | 6.6[9] | |
| Eastern Europe | 2.1[9] | 2.4[9] | 3.1[9] | 3.0[9] | 3.1[9] | 3.5[9] | 4.1[9] | 4.4[9] | 3.5[9] | 2.8[9] | 2.0[9] | |
| Former USSR | 1.7[9] | 2.6[9] | 3.9[9] | 3.7[9] | 4.4[9] | 5.3[9] | 7.0[9] | 8.7[9] | 7.1[9] | 6.4[9] | 4.9[9] | |
| Total Europe | 14.5[9] | 14.5[9] | 20.1[9] | 20.0[9] | 21.0[9] | 21.6[9] | 25.9[9] | 27.7[9] | 22.7[9] | 18.4[9] | 13.5[9] | 9.8[10] |
| World | 100.0[9] | 100.0[9] | 100.0[9] | 100.0[9] | 100.0[9] | 100.0[9] | 100.0[9] | 100.0[9] | 100.0[9] | 100.0[9] | 100.0[9] | 100.0[9] |
- Note: These numbers do not include the population of European countries' colonies, only the population within Europe.
Total population


330,000,000 people lived in Europe in 1916.[11] In 1950 there were 549,000,000.[12] The population of Europe in 2015 was estimated to be 741 million according to the United Nations,[12] which was slightly less than 11% of the world population. The precise figure depends on the exact definition of the geographic extent of Europe. The population of the European Union (EU) was 509 million as of 2015.[13] Non-EU countries situated in Europe in their entirety[14] account for another 90 million. Five transcontinental countries[15] have a total of 247 million people, of which about half reside in Europe proper.
As it stands now, around 10% of the world's people live in Europe. If demographic trends keep their pace, its share may fall to around 7% in 2050, but still amounting to 716 million people in absolute numbers, according to the United Nations estimate.[12] (The decline in the percentage is partly due to high fertility rates in Africa and South America.) The sub-replacement fertility and high life expectancy in most European states mean a declining and aging population. High immigration and emigration levels within and from outside the continent are taking place and quickly changing countries, specifically in Western Europe, from a single ethnic group to a multicultural society. These trends can change societies' economies as well as their political and social institutions. [how?][citation needed]
Vital statistics
| Year | Average population |
Live births | Deaths | Natural change |
Crude rates (per 1000) | Total fertility rate |
Life expectancy | |||
|---|---|---|---|---|---|---|---|---|---|---|
| Births | Deaths | Natural change |
Migration change | |||||||
| 1950 | 549,721,718 | 12,202,220 | 6,473,233 | 5,728,987 | 22.2 | 11.8 | 10.4 | -1.6 | 2.70 | 62.8 |
| 1951 | 554,559,502 | 12,112,425 | 6,609,794 | 5,502,631 | 21.8 | 11.9 | 9.9 | -0.8 | 2.66 | 62.8 |
| 1952 | 559,609,904 | 12,142,368 | 6,265,135 | 5,877,233 | 21.7 | 11.2 | 10.5 | -0.8 | 2.66 | 64.0 |
| 1953 | 565,058,633 | 12,120,826 | 6,220,937 | 5,899,889 | 21.5 | 11.0 | 10.4 | -0.5 | 2.64 | 64.7 |
| 1954 | 570,670,994 | 12,151,779 | 6,072,645 | 6,079,134 | 21.3 | 10.6 | 10.7 | -0.8 | 2.64 | 65.5 |
| 1955 | 576,304,974 | 12,134,270 | 5,987,151 | 6,147,119 | 21.1 | 10.4 | 10.7 | -0.9 | 2.63 | 66.0 |
| 1956 | 581,975,516 | 12,133,583 | 5,899,594 | 6,233,989 | 20.8 | 10.1 | 10.7 | -0.8 | 2.62 | 66.9 |
| 1957 | 587,711,635 | 12,194,100 | 5,963,269 | 6,230,831 | 20.7 | 10.1 | 10.6 | -0.5 | 2.62 | 66.9 |
| 1958 | 593,669,297 | 12,177,600 | 5,647,571 | 6,530,029 | 20.5 | 9.5 | 11.0 | -0.9 | 2.60 | 68.2 |
| 1959 | 599,684,870 | 12,178,245 | 5,816,056 | 6,362,189 | 20.3 | 9.7 | 10.6 | -0.7 | 2.60 | 68.1 |
| 1960 | 605,629,870 | 12,098,378 | 5,783,828 | 6,314,550 | 20.0 | 9.6 | 10.4 | -0.4 | 2.58 | 68.8 |
| 1961 | 611,711,020 | 11,990,399 | 5,749,292 | 6,241,107 | 19.6 | 9.4 | 10.2 | -0.5 | 2.56 | 69.1 |
| 1962 | 617,672,206 | 11,784,056 | 6,023,706 | 5,760,350 | 19.1 | 9.8 | 9.3 | -0.1 | 2.53 | 68.9 |
| 1963 | 623,335,994 | 11,654,646 | 6,031,219 | 5,623,427 | 18.7 | 9.7 | 9.0 | 0 | 2.52 | 69.2 |
| 1964 | 628,944,878 | 11,467,618 | 5,843,514 | 5,624,104 | 18.2 | 9.3 | 8.9 | -0.4 | 2.50 | 69.9 |
| 1965 | 634,267,606 | 11,141,596 | 6,058,752 | 5,082,844 | 17.6 | 9.6 | 8.0 | -0.1 | 2.45 | 69.8 |
| 1966 | 639,264,461 | 10,950,076 | 6,074,808 | 4,875,268 | 17.1 | 9.5 | 7.6 | 0 | 2.42 | 70.0 |
| 1967 | 644,114,436 | 10,969,039 | 6,204,646 | 4,764,393 | 17.0 | 9.6 | 7.4 | -0.4 | 2.42 | 70.0 |
| 1968 | 648,610,191 | 10,821,004 | 6,427,622 | 4,393,382 | 16.7 | 9.9 | 6.8 | -0.4 | 2.38 | 69.9 |
| 1969 | 652,740,596 | 10,685,498 | 6,652,543 | 4,032,955 | 16.4 | 10.2 | 6.2 | -0.4 | 2.33 | 69.6 |
| 1970 | 656,521,426 | 10,568,071 | 6,602,177 | 3,965,894 | 16.1 | 10.1 | 6.0 | 0 | 2.28 | 70.0 |
| 1971 | 660,476,010 | 10,662,541 | 6,675,051 | 3,987,490 | 16.1 | 10.1 | 6.0 | 0.5 | 2.27 | 70.1 |
| 1972 | 664,799,679 | 10,499,844 | 6,699,913 | 3,799,931 | 15.8 | 10.1 | 5.7 | 0.5 | 2.21 | 70.3 |
| 1973 | 668,909,022 | 10,322,172 | 6,814,598 | 3,507,574 | 15.4 | 10.2 | 5.2 | 0.8 | 2.14 | 70.4 |
| 1974 | 672,912,941 | 10,406,013 | 6,818,259 | 3,587,754 | 15.5 | 10.1 | 5.3 | 0.4 | 2.13 | 70.6 |
| 1975 | 676,770,845 | 10,285,047 | 7,009,188 | 3,275,859 | 15.2 | 10.4 | 4.8 | 0.5 | 2.07 | 70.5 |
| 1976 | 680,361,150 | 10,242,399 | 7,085,837 | 3,156,562 | 15.1 | 10.4 | 4.6 | 0.5 | 2.03 | 70.6 |
| 1977 | 683,848,710 | 10,171,264 | 7,039,667 | 3,131,597 | 14.9 | 10.3 | 4.6 | 0.2 | 1.99 | 70.9 |
| 1978 | 687,149,553 | 10,143,418 | 7,183,531 | 2,959,887 | 14.8 | 10.5 | 4.3 | 0.3 | 1.96 | 70.9 |
| 1979 | 690,287,705 | 10,159,933 | 7,268,744 | 2,891,189 | 14.7 | 10.5 | 4.2 | 0.4 | 1.95 | 71.0 |
| 1980 | 693,437,228 | 10,156,371 | 7,422,720 | 2,733,651 | 14.6 | 10.7 | 3.9 | 0.4 | 1.93 | 70.9 |
| 1981 | 696,429,190 | 10,053,030 | 7,404,116 | 2,648,914 | 14.4 | 10.6 | 3.8 | 0.2 | 1.89 | 71.2 |
| 1982 | 699,220,370 | 10,102,647 | 7,373,734 | 2,728,913 | 14.4 | 10.5 | 3.9 | 0.1 | 1.89 | 71.5 |
| 1983 | 702,014,774 | 10,078,184 | 7,562,097 | 2,516,087 | 14.4 | 10.8 | 3.6 | 0.4 | 1.87 | 71.5 |
| 1984 | 704,798,623 | 10,050,688 | 7,584,914 | 2,465,774 | 14.3 | 10.8 | 3.5 | 0.4 | 1.86 | 71.6 |
| 1985 | 707,516,287 | 9,969,920 | 7,702,883 | 2,267,037 | 14.1 | 10.9 | 3.2 | 0.9 | 1.84 | 71.7 |
| 1986 | 710,385,076 | 9,987,274 | 7,423,641 | 2,563,633 | 14.1 | 10.5 | 3.6 | 0.7 | 1.84 | 72.5 |
| 1987 | 713,465,338 | 9,966,304 | 7,407,417 | 2,558,887 | 14.0 | 10.4 | 3.6 | 0.6 | 1.84 | 72.7 |
| 1988 | 716,444,431 | 9,840,567 | 7,475,880 | 2,364,687 | 13.7 | 10.4 | 3.3 | 0.4 | 1.82 | 72.8 |
| 1989 | 719,107,883 | 9,495,117 | 7,527,904 | 1,967,213 | 13.2 | 10.5 | 2.7 | 0.6 | 1.76 | 72.9 |
| 1990 | 721,497,282 | 9,235,425 | 7,681,197 | 1,554,228 | 12.8 | 10.6 | 2.2 | 0.7 | 1.72 | 72.9 |
| 1991 | 723,602,898 | 8,888,909 | 7,796,555 | 1,092,354 | 12.3 | 10.8 | 1.5 | 0.8 | 1.66 | 72.9 |
| 1992 | 725,259,493 | 8,523,515 | 7,935,829 | 587,686 | 11.8 | 10.9 | 0.8 | 0.8 | 1.60 | 72.7 |
| 1993 | 726,441,892 | 8,138,793 | 8,412,609 | -273,816 | 11.2 | 11.6 | -0.4 | 1.4 | 1.53 | 72.1 |
| 1994 | 727,063,162 | 7,913,453 | 8,492,472 | -579,019 | 10.9 | 11.7 | -0.8 | 1.1 | 1.50 | 72.1 |
| 1995 | 727,300,408 | 7,663,831 | 8,553,348 | -889,517 | 10.5 | 11.8 | -1.2 | 1.4 | 1.46 | 72.2 |
| 1996 | 727,453,566 | 7,581,575 | 8,394,631 | -813,056 | 10.4 | 11.5 | -1.1 | 1.3 | 1.45 | 72.7 |
| 1997 | 727,566,480 | 7,476,674 | 8,240,385 | -763,711 | 10.3 | 11.3 | -1.0 | 0.8 | 1.43 | 73.2 |
| 1998 | 727,445,606 | 7,369,527 | 8,193,143 | -823,616 | 10.1 | 11.3 | -1.1 | 0.6 | 1.42 | 73.6 |
| 1999 | 727,100,016 | 7,264,382 | 8,402,774 | -1,138,392 | 10.0 | 11.6 | -1.6 | 1.4 | 1.40 | 73.4 |
| 2000 | 726,968,473 | 7,325,763 | 8,401,888 | -1,076,125 | 10.1 | 11.6 | -1.5 | 1.4 | 1.42 | 73.5 |
| 2001 | 726,878,371 | 7,277,594 | 8,364,598 | -1,087,004 | 10.0 | 11.5 | -1.5 | 1.6 | 1.41 | 73.8 |
| 2002 | 726,939,358 | 7,330,526 | 8,520,890 | -1,190,364 | 10.1 | 11.7 | -1.6 | 2.3 | 1.42 | 73.8 |
| 2003 | 727,424,988 | 7,442,475 | 8,655,471 | -1,212,996 | 10.2 | 11.9 | -1.7 | 2.7 | 1.45 | 73.8 |
| 2004 | 728,163,243 | 7,558,652 | 8,381,363 | -822,711 | 10.4 | 11.5 | -1.1 | 2.2 | 1.47 | 74.4 |
| 2005 | 728,950,486 | 7,568,637 | 8,494,391 | -925,754 | 10.4 | 11.7 | -1.3 | 2.5 | 1.47 | 74.5 |
| 2006 | 729,857,708 | 7,703,029 | 8,237,212 | -534,183 | 10.6 | 11.3 | -0.7 | 2.8 | 1.50 | 75.2 |
| 2007 | 731,393,136 | 7,886,129 | 8,187,820 | -301,691 | 10.8 | 11.2 | -0.4 | 2.9 | 1.54 | 75.6 |
| 2008 | 733,256,182 | 8,169,398 | 8,195,293 | -25,895 | 11.1 | 11.2 | 0.0 | 2.2 | 1.59 | 75.8 |
| 2009 | 734,902,805 | 8,208,268 | 8,099,043 | 109,225 | 11.2 | 11.0 | 0.1 | 1.8 | 1.60 | 76.3 |
| 2010 | 736,276,813 | 8,227,484 | 8,128,387 | 99,097 | 11.2 | 11.0 | 0.1 | 1.7 | 1.61 | 76.5 |
| 2011 | 737,589,666 | 8,132,980 | 7,958,960 | 174,020 | 11.0 | 10.8 | 0.2 | 1.6 | 1.60 | 77.1 |
| 2012 | 738,907,594 | 8,178,804 | 8,078,292 | 100,512 | 11.1 | 10.9 | 0.1 | 1.4 | 1.62 | 77.3 |
| 2013 | 740,013,806 | 8,039,791 | 8,033,963 | 5,828 | 10.9 | 10.9 | 0.0 | 1.4 | 1.60 | 77.6 |
| 2014 | 741,014,147 | 8,067,454 | 7,955,740 | 111,714 | 10.9 | 10.7 | 0.2 | 1.3 | 1.62 | 77.9 |
| 2015 | 742,107,449 | 8,004,465 | 8,177,599 | -173,134 | 10.8 | 11.0 | -0.2 | 1.8 | 1.62 | 78.0 |
| 2016 | 743,318,582 | 7,950,684 | 8,009,194 | -58,510 | 10.7 | 10.8 | -0.1 | 1.6 | 1.62 | 78.4 |
| 2017 | 744,449,361 | 7,617,755 | 8,076,159 | -458,404 | 10.2 | 10.8 | -0.6 | 1.8 | 1.56 | 78.7 |
| 2018 | 745,359,130 | 7,375,157 | 8,112,356 | -737,199 | 9.9 | 10.9 | -1.0 | 2.1 | 1.53 | 78.8 |
| 2019 | 746,189,645 | 7,108,392 | 8,020,246 | -911,854 | 9.5 | 10.7 | -1.2 | 1.2 | 1.49 | 79.1 |
| 2020 | 746,225,356 | 6,938,739 | 9,119,281 | -2,180,542 | 9.3 | 12.2 | -2.9 | 1.5 | 1.47 | 77.7 |
| 2021 | 745,173,774 | 6,879,818 | 9,656,398 | -2,776,580 | 9.2 | 13.0 | -3.7 | 1.48 | 77.0 | |
| 2022 | 746,964,593 | 6,520,637 | 8,811,692 | -2,291,055 | 8.7 | 11.8 | -3.1 | 1.41 | 78.2 | |
| 2023 | 745,602,875 | 6,337,695 | 8,293,264 | -1,955,569 | 8.5 | 11.1 | -2.6 | 1.40 | 79.1 | |
| 2024 | 745,083,824 | 6,345,992 | 8,431,000 | −2,085,008 | 8.5 | 11.4 | -3.0 | 1.40 | 79.5 | |
| 2025(p) | 744,398,832 | 1.41 | ||||||||
Population by country
.svg)
According to different definitions, such as consideration of the concept of Central Europe, the following territories and regions may be subject to various other categorisations aside from geographic conventions.
| Country (or territory) | Population [1][2][17] |
Area (km2)[18] |
Density (per km2) |
|---|---|---|---|
| 2,854,710 | 28,748 | 99 | |
| 79,034 | 468 | 169 | |
| 2,790,974 | 29,743 | 94 | |
| 8,922,082 | 83,871 | 106 | |
| 10,312,992 | 86,600 | 119 | |
| 9,578,167 | 207,600 | 46 | |
| 11,611,419 | 30,528 | 380 | |
| 3,270,943 | 51,209 | 64 | |
| 6,520,314 | 110,900 | 59 | |
| 4,060,135 | 56,594 | 72 | |
| 1,244,188 | 9,251 | 134 | |
| 10,510,751 | 78,866 | 133 | |
| 6,029,607 | 43,094 | 140 | |
| 1,328,701 | 45,227 | 29 | |
| 49,709 | 1,399 | 35.6 | |
| 5,535,992 | 336,852 | 16 | |
| 64,531,444 | 551,500 | 117 | |
| 3,757,980 | 69,700 | 54 | |
| 83,408,554 | 357,137 | 234 | |
| 32,669 | 6 | 5,445 | |
| 10,445,365 | 131,957 | 79 | |
| 65,345 | 63 | 1,037 | |
| 9,709,786 | 93,026 | 104 | |
| 370,335 | 103,000 | 4 | |
| 4,986,526 | 69,825 | 71 | |
| 84,263 | 572 | 147 | |
| 59,240,329 | 301,339 | 197 | |
| 97,857 | 116 | 844 | |
| 1,859,203 | 10,887 | 171 | |
| 1,873,919 | 64,562 | 29 | |
| 39,039 | 160 | 244 | |
| 2,786,651 | 65,300 | 43 | |
| 639,321 | 2,586 | 247 | |
| 526,748 | 316 | 1,667 | |
| 3,061,506 | 33,846 | 90 | |
| 36,686 | 2 | 18,343 | |
| 627,859 | 13,812 | 45 | |
| 17,501,696 | 37,354 | 469 | |
| 2,103,330 | 25,713 | 82 | |
| 5,403,021 | 323,787 | 17 | |
| 38,307,726 | 311,888 | 123 | |
| 10,290,103 | 92,212 | 112 | |
| 19,328,560 | 238,391 | 81 | |
| 145,102,755 | 17,098,246 | 8 | |
| 33,745 | 61 | 553 | |
| 7,296,769 | 88,361 | 83 | |
| 5,447,622 | 49,036 | 111 | |
| 2,119,410 | 20,273 | 105 | |
| 47,486,935 | 505,992 | 94 | |
| 2,868 | 62,422 | 0 | |
| 10,467,097 | 450,295 | 23 | |
| 8,691,406 | 41,285 | 211 | |
| 505,000 | 4,163 | 121.3 | |
| 84,775,404 | 783,562 | 108 | |
| 43,531,422 | 603,500 | 72 | |
| 67,281,039 | 242,495 | 277 | |
| 842 | 0.4 | 1,913.6 | |
| 28,666 | 1,580 | 18 |
* indicates link goes to article on demographics of the country (or territory), not just the country itself.
Age

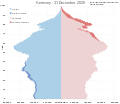
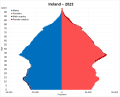
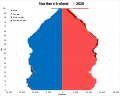
Mirroring their mostly sub-replacement fertility and high life expectancy, European countries tend to have older populations overall. They had nine of the top ten highest median ages in national populations in 2005. Only Japan had an older population.[19]

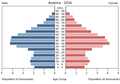 Andorra (2016)
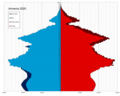


 Czech Republic (2024)
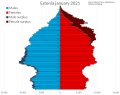 Estonia (2021)
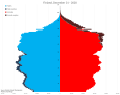 Finland (2020)
 France (2021)
 Germany (2020)


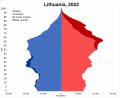 Lithuania (2022)


 Norway (2021)
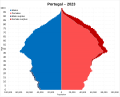 Portugal (2020)


 Switzerland (and foreigners)


Fertility

According to Eurostat, the average birth rate in the European Union was 1.5 children per woman in 2020. The EU countries with the highest rates were France (1.83 live births per woman), Romania (1.80) and Czechia (1.71). The lowest rates were found in Malta (1.13), Spain (1.19) and Italy (1.24).[21]
The reasons that Italian citizens give for not having children are economic costs, fear of losing their jobs, and lack of services for families.[22]
Eurostat says that the proportion of children born to foreign mothers, including both from other EU member states and from non-EU countries, has been increasing in the EU since 2013 and stood at 21% in 2020.[21]
Religion
religious_group_by_EU_member_state_-_Eurobarometer_2019.svg)

Over the last several centuries, religious practice has been on the decline in a process of secularization. Several European countries have experienced a decline in church attendance as well as a decline in the number of people professing a religious belief. The 2010 Eurobarometer survey found that, on average, 51% of the citizens of the European Union that they believe there is a God, 26% believe there is some sort of spirit or life force and 20% don't believe there is any sort of spirit, God or life force. 3% declined to answer.[24] The Eurobarometer survey must be taken with caution, however, as there are discrepancies between it and national census results. For example, in the United Kingdom, the 2001 census revealed that over 70% of the population regarded themselves as "Christians" with only 15% professing to have no religion, though the wording of the question has been criticized as "misleading" by the British Humanist Association.[25] The 2011 census showed a dramatic reduction to less than 60% of the population regarding themselves as "Christians".[26]
Despite its decline, Christianity is still the largest religion in Europe. According to a survey published in 2010, 76.2% of Europeans identified themselves as Christians.[27][28] Catholics were the largest Christian group in Europe, accounting for more than 48% of European Christians.[29] The second-largest Christian group in Europe was the Orthodox, who made up 32% of European Christians.[29] And about 19% of European Christians were part of the Protestant tradition. Europe constitutes in absolute terms the world's largest Christian population.[30] According to Scholars, in 2017, Europe's population was 77.8% Christian (up from 74.9% 1970),[31][32] these changes were largely result of the collapse of Communism and switching to Christianity in the former Soviet Union and Eastern Bloc countries.[31]
According to a 2003 study,[33] 47% of French people declared themselves as agnostics in 2003. This situation is often called "Post-Christian Europe". A decrease in religiousness and church attendance in western Europe (especially in Belgium, the Czech Republic, Finland, France, Germany, the United Kingdom, Norway, the Netherlands and Sweden) has been noted. According to a survey published in 2012, atheists and agnostics make up about 18.2% of the European population.[34] According to the same survey the religiously unaffiliated make up the majority of the population only in two European countries: Czech Republic (75%) and Estonia (60%).[34]
According to another survey about Religiosity in the European Union from 2012 by Eurobarometer, Christianity was the largest religion in the Union (accounting for 72% of the total population), Catholics were with 48% the largest Christian group in the Union, Protestants made up 12%, Eastern Orthodox made up 8% and other Christians accounted for 4% of the total population.[35] Non-believers/agnostics accounted for 16%, atheists accounted for 7% and Muslims accounted for 2%.[36]
Ethnic groups
Pan and Pfeil (2004) count 87 distinct "peoples of Europe", of which 33 form the majority population in at least one sovereign state, while the remaining 54 constitute ethnic minorities. The total number of national minority populations in Europe is estimated at 105 million people, or 14% of 770 million Europeans. (including Europeans in Siberia)[37]
The largest ethnic groups are the Russians, with 117 million, and the Germans, with 72 million. In some countries such as the United Kingdom, France and Spain, the designation of nationality may controversially take on ethnic aspects, subsuming smaller ethnic groups such as Scots, Welsh, Cornish, Northern Irish, Bretons, Catalans, and Basques, making it difficult to quantify a "British" or "French" ethnicity, for example.
There are an estimated 10 million Romani people in Europe.[38]
Language

Most of the languages of Europe belong to the Indo-European language family. This family is divided into a number of branches, including Romance, Germanic, Baltic, Slavic, Albanian, Celtic, Armenian and Greek. The Uralic languages, which include Hungarian, Finnish, Estonian, Udmurt, Mordvin and Sami also have a significant presence in Europe. The Turkic family also has several European members, while the North Caucasian and Kartvelian families which include Georgian, Circassian, Chechen and Abkhaz anong others are important in the southeastern extremity of geographical Europe. The Basque language of the western Pyrenees is an isolate unrelated to any other group, while Maltese is the only Semitic language in Europe with national language status, although Arabic, Hebrew and Neo-Aramaic dialects are spoken by migrant populations. The Kalmyk language, is a Mongolic language, spoken in Kalmykia, located directly north of the North Caucasus in Eastern Europe. The most spoken language of Europe is Russian, which belongs to the group of Slavic languages.
Languages that are not official state languages are protected in many European countries by the European Charter for Regional or Minority Languages. These can include languages spoken by relatively many people, such as Catalan and Basque in Spain, Frisian in the Netherlands, as well as languages spoken by relatively few such as Cornish, Manx and Scottish Gaelic in the United Kingdom, and Romansch in Switzerland.
Genetic origins

Homo sapiens appeared in Europe roughly 40,000 years ago, with the settlement of the Cro-Magnons, followed by European hunter-gatherers and Early European Farmers (EEF). Over the prehistoric period there was continuous settlement in Europe, notably by the immediate descendants of the Proto-Indo-Europeans who migrated west after the advent of the Neolithic Revolution.[40]
Mitochondrial DNA and Y-chromosome DNA
Studies of mitochondrial DNA (mtDNA) have suggested substantial genetic homogeneity of European populations,[41] with only a few geographic or linguistic isolates appearing to be genetic isolates as well.[42] On the other hand, analyses of the Y chromosome[43][44] and of autosomal diversity[45] have shown a general gradient of genetic similarity running from the southeast to the northwest of the continent.
Autosomal DNA

According to geneticist David Reich, based on ancient human genomes that his laboratory sequenced in 2016, Europeans formed from four West-Eurasian ancestral components in varying degrees: Western Hunter-Gatherers (WHG), Eastern Hunter-Gatherers (EHG), Neolithic Levant farmers and Neolithic Iranian farmers respectively.[47]
Population structure
A study in May 2009[48] that examined 19 populations from Europe using 270,000 single nucleotide polymorphisms (SNPs) highlighted the genetic diversity of European populations corresponding to the northwest to southeast gradient and distinguished "several distinct regions" within Europe:
- Finland
- the Baltic states (Estonia, Latvia and Lithuania), western Russia and Poland
- Central and Western Europe
- Italy, South-Eastern Europe, Southern Russia
In this study, Fst (fixation index) was found to correlate considerably with geographic distances ranging from ≤0.0010 for neighbouring populations to 0.0230 for Southern Italy and Finland. For comparisons, pair-wise Fst of non-European samples were as follows: Europeans – Yoruba (West Africans) 0.1530; Europeans – Chinese 0.1100; Yoruba (West Africans) – Chinese 0.1900.[48]: Table S2
See also
- Area and population of European countries
- Classical demography
- Demographics of the European Union
- Ethnic groups in Europe
- European diasporas
- European Union statistics
- Migration from Latin America to Europe
- List of cities in the European Union by population within city limits
- List of urban areas of the European Union
- List of European countries by population growth rate
- List of European countries by population
- List of metropolitan areas in Europe
- Medieval demography
- Demographics of the world
- List of countries by fertility rate
Notes
^ a: Continental regions as per UN categorisations/map. Depending on definitions, various territories cited below may be in one or both of Europe and Asia, or Africa.
^ b: Includes Transnistria, a region that has declared, and de facto achieved, independence; however, it is not recognised de jure by sovereign states.
^ c: Russia is considered a transcontinental country in Eastern Europe and Northern Asia. However, the population and area figures include the entire state.
^ d: Guernsey, the Isle of Man and Jersey are Crown Dependencies of the United Kingdom. Other Channel Islands in the Bailiwick of Guernsey include Alderney and Sark.
^ e: Cyprus is physiographically entirely in Western Asia, but it has strong historical and sociopolitical connections with Europe. The population and area figures refer to the entire state, including the de facto independent part Northern Cyprus.
^ f: Figures for Portugal include the Azores and Madeira archipelagos, both in Northern Atlantic.
^ g: Area figure for Serbia includes Kosovo, a province that unilaterally declared its independence from Serbia on 17 February 2008, and whose sovereign status is unclear. Population and density figures are 2010 estimates and are given without the disputed territory of Kosovo.
^ h: Figures for France include metropolitan France but not overseas departments and territories as they are not part of the European continent.
^ j: Kazakhstan is physiographically considered a transcontinental country in Central Asia (UN region) and Eastern Europe, with European territory west of the Ural Mountains and both the Ural and Emba rivers. However, area and population figures refer to the entire country.
^ k: Armenia is physiographically entirely in Western Asia, but it has strong historical and sociopolitical connections with Europe. The population and area figures include the entire state respectively.
^ m: Georgia is often considered a transcontinental country in Western Asia and Eastern Europe. However, the population and area figures include the entire state. This also includes Georgian estimates for Abkhazia and South Ossetia, two regions that have declared and de facto achieved independence. The International recognition, however, is limited.
^ o: The total figures for area and population includes the whole of the transcontinental countries. The precision of these figure is compromised by the ambiguous geographical extend of Europe and the lack of references for European portions of transcontinental countries.
^ p: Kosovo unilaterally declared its independence from Serbia on 17 February 2008. Its sovereign status is unclear. Its population is a 2007 estimate.
^ r: Abkhazia and South Ossetia unilaterally declared their independence from Georgia on 25 August 1990 and 28 November 1991 respectively. Their sovereign status is unclear. Population figures stated as of 2003 census and 2000 estimates respectively.