South Asian Canadians
From Wikipedia, the free encyclopedia
South Asian Canadians are Canadians who were either born in or can trace their ancestry to South Asia or the Indian subcontinent, which includes the nations of India, Pakistan, Bangladesh, Nepal, Bhutan, Sri Lanka, and the Maldives.[3] The term also includes immigrants from South Asian communities in East and South Africa, Guyana, Trinidad and Tobago, Fiji, Mauritius, and the rest of the world.[4]

South Asian ancestry % by census division in Canada (2021)
| ||
| Total population | ||
|---|---|---|
| ||
| Regions with significant populations | ||
| Southern Ontario, Southwestern BC, Central Alberta, Southern Quebec, Most urban areas | ||
| Languages | ||
| Religion | ||
| ||
| Related ethnic groups | ||
The term South Asian Canadian is a subgroup of Asian Canadian and, according to Statistics Canada, can further be divided by nationality, such as Indian Canadian, Pakistani Canadian, and Bangladeshi Canadian.[5] As of 2021, South Asians (7.1 percent) comprise the second largest pan-ethnic group in Canada after Europeans (69.8 percent).[1][6]
According to the 2021 Canadian census, 2,571,400 Canadians had South Asian geographical origins, constituting approximately 7.1 percent of the total population and 35.1 percent of the total Asian Canadian population.[1] This makes them the largest visible minority group in Canada comprising 26.7 percent of the visible minority population, followed by Chinese and Black Canadians respectively.[1]
The largest South Asian Canadian communities are found in the provinces of Ontario, British Columbia and Alberta, while metropolitan areas with large populations include Toronto (1,182,485), Vancouver (369,295), Calgary (153,200), Edmonton (123,340), and Montréal (121,260).[1] Over half (60.3 percent) of South Asian Canadians live in two metropolitan areas as of 2021; Greater Toronto and Metro Vancouver.[1]
Terminology
In Canada, the term "Asian" broadly includes people from East Asia, Southeast Asia, South Asia, Central Asia, and West Asia.[7][8] The term "South Asian" refers to individuals who trace their origins to India, Nepal, Pakistan, Bangladesh, Sri Lanka, Bhutan, and the Maldives.[9] Despite its location, Myanmar is not typically included.[9][10][11] The term "East Indian" was used to distinguish people of Indian origin from Aboriginal peoples and Afro-Caribbeans (West Indians), though "South Asian" has become the Census designation.[4][better source needed]
Canadians from South Asia may also be identified by their country of origin or cultural backgrounds (e.g., Punjabi, Tamil, or Bengali).[4] The term "East Indian" was a historical term used widely in Canada to refer to people from India as opposed to who have also been referred to as "Indian". This term has been made less common after the introduction of the general term "South Asian" in areas with significant Indian Canadian populations like Toronto.[citation needed]
Brown[12][13][14][15][16] and Desi are also terms used to refer to Canadians from South Asia. However, these are avoided in more formal contexts due to their ambiguity and the possibility of being perceived as derogatory.[citation needed]
Statistics Canada lists both cultural backgrounds like Bengali, Gujarati, Tamil, Malayali, and Goan in addition to categories like East Indian, Bangladeshi, Sri Lankan, and Pakistani.[17][18][19]
History
.jpg)
Late 19th century
The first well-known record of Canadians from South Asia dates back to 1897, when Punjabi Sikh soldiers were invited to British Columbia, en route from India to Britain, as a part of Queen Victoria’s Diamond Jubilee.[a][b][c] However, a 2025 study revealed that South Asians were present in Eastern Canada since the country’s founding,[23] as the 1871 census identified 11 people of South Asian origin, with 8 persons from Ontario, and the remaining 3 from Nova Scotia.[d][24][23] The early presence in Ontario and Nova Scotia demonstrates that South Asians were part of Canadian society decades earlier than previously recognized, and in regions outside the well-known Pacific migration routes to British Columbia, with the largest concentration residing in what is now Lakeshore, Ontario.[23]
Early 20th century

With an estimated population of 100 by 1900,[e] further South Asian settlement waves to Canada occurred in the few years after the turn of the 20th century; after hearing stories about the high wages being paid in British Columbia, some Punjabi British Indian soldiers stationed in British Malaya, British Hong Kong, and other British-controlled Chinese cities emigrated to Canada and settled in the western province.[f][g][h][i] Attracted by these wages, more Sikh men began immigrating into British Columbia, working mainly in industries such as mining, logging and railroads.[j][k] Many of these men, who arrived without their families, settled in the British Columbia Interior, Greater Vancouver, Vancouver Island, and the Fraser Valley in what is now Abbotsford, British Columbia.[26][l][m][n][o]

Punjabi Sikh settlers first arrived in Golden, British Columbia to work at the Columbia River Lumber Company in 1902.[29] A notable moment in early South Asian Canadian history, these early settlers built the first Gurdwara (Sikh temple) in Canada and North America in 1905,[30][31] which would later be destroyed by fire in 1926.[32] During this formative era of migration from the subcontinent to Canada, South Asian settlers did not receive much attention from all levels of government or the press; by many accounts, their new homes in British Columbia were relatively welcoming and inclusive, given their status as fellow British subjects.[p][q]
The government in British Columbia enacted laws limiting the rights and privileges of Canadians from South Asian countries in 1907, preventing them from voting and denying them access to political office, public sector employment, and other professions.[33] As a result, many migrated south from Vancouver across the border to the United States, where some became the victims of the 1907 Bellingham riots.[34] At the same time, by 1907–08, many South Asian Canadians faced discrimination and xenophobia from those of European (Anglo-British) background, similar to that experienced by East Asian Canadians, such as the Japanese and Chinese communities.[r][s] European settlers viewed Asian settlers, and included the Indians, as a threat to the European nature of Canada.[t] In addition, many Asian migrants worked for lower wages, which at the time agitated the European (Anglo-British) majority.[36]
In an effort to prevent South Asians from immigrating to Canada, the continuous journey regulation was enacted on January 8, 1908.[u] The law prohibited any immigrants from landing in Canada "unless they came from the country of their birth or citizenship by a continuous journey, and on through tickets purchased before leaving the country of their birth or citizenship".[21]: 138 As there was no direct steamship route from British India to Canada, this effectively barred immigration from the subcontinent, while the regulation also prevented Indian soldiers stationed in British Hong Kong and Japan from immigrating to Canada.[v] Annual immigration figures between 1907–08 and 1908–09 reflected the enactment of the continuous journey regulation: 2,623 persons of Indian origin arrived in Canada during the former fiscal year, declining to six persons during the latter.[37][21]: 15 Year-end statistics in 1908 indicated that the South Asian Canadian population stood at 5,179 persons or 0.08 percent of the national population,[37] primarily Punjabi settlers concentrated in British Columbia. Many later migrated south to the United States, returned to British India or British Hong Kong, and the 1911 Canadian census later recorded a population decline to 2,342 persons or 0.03 percent of the national population.[38]
.jpg)
The second Gurdwara to be built in Canada was in 1908 in Kitsilano (Vancouver) to serve a growing number of Punjabi Sikh settlers who worked at nearby sawmills along False Creek.[39] By 1911, the Gur Sikh Temple opened in Abbotsford, British Columbia becoming the third Gurdwara built in Canada. Designated as a national historic site of Canada in 2002, it is presently the oldest existing Gurdwara in the country, as the first temple built in Golden was destroyed by fire in 1926, while the second built in Kitsilano was closed and demolished in 1970, when the temple society relocated to the newly built Gurdwara on Ross Street in the Sunset neighbourhood of South Vancouver. By 1912, a year after the construction of the Gur Sikh Temple in Abbotsford, the fourth Gurdwara was established in Victoria, British Columbia on Topaz Avenue,[40] while a fifth soon followed at the Fraser Mills (Coquitlam) settlement later that year.[41]
Later in the decade, most Punjabi Sikhs continued to seek employment in the forestry industry at various sawmills across British Columbia, more Gurdwaras were built, including at the Queensborough (New Westminster) settlement in 1919.[42][43][44] This was soon followed by another at the Paldi (Vancouver Island) settlement, also in 1919.[45][46][47][48]
Komagata Maru incident
.jpg)
As a result of the continuous journey regulation enacted in 1908, a notable example of early anti-South Asian sentiment in Canada was the Komagata Maru incident, which occurred in 1914. Baba Gurdit Singh, a successful Punjabi businessman living in British Singapore, attempted to circumnavigate the regulation and chartered a Japanese steamship known as the SS Komagata Maru to travel from Kolkata, India to Vancouver, British Columbia, Canada.[w] The ship made stops in Hong Kong, Shanghai and Yokohama, where it picked up more would-be settlers.[x] In total the ship carried 376 passengers, all originating from the Punjab Province (British India) and registered as British subjects; of whom 337 were Punjabi Sikhs, 27 were Punjabi Muslims and 12 were Punjabi Hindus. Upon arriving in Vancouver though the ship was not permitted to dock with several British Columbian politicians such as Conservative MP Henry Herbert Stevens campaigning against its right to dock.[49][50][28]
With the ship held at Coal Harbour in Burrard Inlet in April 1914, some South Asian Canadians already settled in Canada began launching "shore committees" led by Husain Rahim (Gujarati Canadian),[51] Muhammad Akbar (Punjabi Canadian),[51] and Sohan Lal Pathak. These were to protest against the decision not to allow the settlers on the Komagata Maru no to enter Canada. Passengers threatened to start a rebellion, or ghadar, if they were forced back to India. The shore committee raised $22,000 and launched a test case legal battle in the British Columbia Court of Appeal. On July 6, the court unanimously decided they had no authority to interfere with the Department of Immigration and Colonization and had ordered the harbor tug Sea Lion to pull the ship out to sea on July 19.[y] This resulted in rioting between the settlers on board and police officers.[z] The ship was ultimately forced back to India on July 23, 1914, with only 20 of the settlers being allowed to stay in Canada.[28]: 140&169
Mid-20th century

| Year | Pop. | ±% |
|---|---|---|
| 1871 | 11 | — |
| 1901 | 100 | +809.1% |
| 1908 | 5,179 | +5079.0% |
| 1911 | 2,342 | −54.8% |
| 1921 | 1,016 | −56.6% |
| 1931 | 1,400 | +37.8% |
| 1941 | 1,465 | +4.6% |
| 1951 | 2,148 | +46.6% |
| 1961 | 6,774 | +215.4% |
| 1971 | 67,925 | +902.7% |
| 1981 | 223,235 | +228.6% |
| 1986 | 314,305 | +40.8% |
| 1991 | 505,515 | +60.8% |
| 1996 | 723,345 | +43.1% |
| 2001 | 963,190 | +33.2% |
| 2006 | 1,316,770 | +36.7% |
| 2011 | 1,615,925 | +22.7% |
| 2016 | 1,963,330 | +21.5% |
| 2021 | 2,571,400 | +31.0% |
| Source: Statistics Canada [24][37][22]: 35 [21]: 15 [35]: 16 [38][52]: 353 [53]: 225 [54]: 236 [55]: 503 [56]: 272 [57]: 2 [58]: 484 [59]: 5 [60]: 2 [61]: 26 [62]: 31&68 [63]: 34 [64]: 47 [65]: 68 [66]: 11 [67][68][69][70][71][1] | ||
.jpg)

The continuous journey regulation remained in effect until 1947, as did most other anti-South Asian laws.[aa] However, pressure from the community resulted in the Canadian government allowing the wife and children of a Canadian husband or father to immigrate. [ab] The South Asian population in Canada remained stagnant; by the mid-1920s, it was just over 1,000 persons.[ac] Despite their declining numbers, Canadians from South Asia grew wealthier; some began to acquire their own lumber mills which were used to produce wood and sawdust for consumer purchase. [ad] During the Great Depression the tight-knit nature of the South Asian community mitigated many of the economic effects the depression had on other communities in Canada.[ae][af][72]
South Asian Canadians were granted the right to vote in 1947.[ag][ah] Following the independence of India, Pakistan and Ceylon (now Sri Lanka), the Canadian government created annual immigration quotas which allowed 150 Indians, 100 Pakistanis, and 50 Sri Lankans to immigrate to Canada each year.[ai][aj][ak][72]
In 1950, 25 years after settling in Canada and nine years after moving to British Columbia from Toronto, Naranjan "Giani" Singh Grewall became the first individual of South Asian ancestry in Canada and North America to be elected to public office after successfully running for a position on the board of commissioners in Mission, British Columbia against six other candidates.[73][74][75][76][77] Grewall was re-elected to the board of commissioners in 1952 and by 1954, was elected to become mayor of Mission.[73][76][77]
"Thank you all citizens of Mission City [...] It is a credit to this community to elect the first East Indian to public office in the history of our great dominion. It shows your broad-mindedness, tolerance and consideration."[75]
— Notice by Naranjan Singh Grewall in the local Mission newspaper following his election to public office, 1950
A millwright and union official, and known as a sportsman and humanitarian philanthropist as well as a lumberman, Grewall eventually established himself as one of the largest employers and most influential business leaders in the northern Fraser Valley. He owned six sawmills, was active in community affairs (serving on the boards or as chairman of a variety of organizations), and was instrumental in helping create Mission's municipal tree farm.[73][75][76][77][78] With strong pro-labour beliefs despite his role as a mill-owner, and following a scandal involving the provincial Ministry of Forestry under the Social Credit-led government, he referred to holders of forest management licenses across British Columbia as Timber Maharajahs, cautioning that within a decade, three or four giant corporations would predominantly control the entire industry in the province, echoing similarities to the archaic zamindar system in South Asia.[76][78] He later ran unsuccessfully for the Co-operative Commonwealth Federation (the precursor of today's New Democratic Party) in the Dewdney riding in the 1956 provincial election.[77][78]
While by the 1950s, South Asian Canadians had gained respect in business in British Columbia primarily for their work in owning sawmills and aiding the development of the provincial forestry industry, racism still existed especially in the upper echelons of society.[76][79] As such, during the campaign period and in the aftermath of running for MLA in 1956, Grewall received personal threats, while the six mills he owned along with his house were all set ablaze by arsonists.[79][al] One year later, on July 17, 1957, while on a business trip, he was suspiciously found dead in a Seattle motel, having been shot in the head.[al][am][79][80] Grewall Street in Mission was named in his honour.[81]
"Every kid in the North Fraser, who thinks he or she is being discriminated against, should read the Grewall story and the challenges he faced."[al]
— Former BC premier Dave Barrett on Naranjan Singh Grewall
Beginning in the 1950s, Canada gradually removed racial and national restrictions from its immigration policies, continuing into the 1960s.[an][ao][ap] With a population numbering 2,158 persons in 1951,[58]: 484 an increase in the number of native-born South Asian Canadians during the baby boom era[82]: 430 alongside annual immigrant arrivals rising from hundreds to thousands resulted in the rapid growth of the community to 6,774 in 1961,[59]: 5 and finally to 67,925 by 1971.[aq][ar][60]: 2
During the post-war era in the late 1940s and early 1950s, there was no particular residential concentration of South Asians in the Vancouver region.[83][as] However, during the latter half of the 1950s and later, throughout the 1960s, many new immigrants began settling on the south slope within the city of Vancouver, growing into the first major inner city South Asian enclave in Canada.[83][84] This was due to the proximity of the gurdwara and the lumber mills.[85] In the following decade, the Punjabi Market (Little India) was established within the Sunset neighbourhood of southeast Vancouver.[86][87] A secondary urban concentration in Metro Vancouver soon also developed in the Edmonds neighbourhood of South Burnaby in the 1970s.[88] In the ensuing two decades, during the 1970s and 1980s, South Asians were located throughout Greater Vancouver and not only in South Vancouver and South Burnaby;[85] about 66 percent of the total population of South Asians in Metro Vancouver lived in Vancouver city – primarily concentrated in the Sunset neighbourhood – while the remaining 33 percent lived in Burnaby, Richmond, and other suburban cities.[35]: 16
Many of the South Asians arriving during the 1970s came from East Africa.[at][72] Discrimination in many African Great Lakes nations like Kenya, Uganda and Tanzania against Indians was growing as a result of their status as a market-dominant minority.[au] This is when a minority group controls a disproportionately large segment of the economy due to their over representation in business and above average education. One notable incident of this was Ugandan dictator Idi Amin's expulsion of 80,000 Ugandan Indians as part of his economic war to allow indigenous Ugandans to regain control of the countries economy.[av] As a result, nearly 20,000 Indians fled to Canada, some directly others after temperately settling in other nations in Africa; they eventually grew to be the first sizable non-Sikh South Asian community in Canada.[aw] Shenaaz Nanji's Governor General's Award-nominated novel Child of Dandelions deals with the expulsion of Indians from Uganda and their immigration to Canada.[89]
Around the same time, during the 1970s, Indo-Caribbeans (mainly from Guyana and Trinidad and Tobago, as well as some from Suriname, Jamaica, and other Caribbean nations), Indo-Fijians, Indian South Africans, and Indo-Mauritians began immigrating to Canada as well, settling in Toronto, Vancouver, Montreal, Calgary, and Edmonton.[ax][ay] Many of these South Asians were descendants of indentured labourers who were brought by the British colonial government to replace enslaved labourers on plantations; after completing their work terms the majority remained in these countries.[ax][50]: 21 Many of the immigrants who arrived from the Caribbean, the African Great Lakes, Mauritius, South Africa, and Fiji were educated professionals who, upon arriving in Canada, worked in the service sector or began their own businesses, as opposed to the industrial sector in which mainly early Sikhs worked.[ax][ay]
Late 20th century
Prior to the wide-scale urbanization of the South Asian Canadian community, the most statistically significant populations were found across rural British Columbia; a legacy of previous waves of immigration and settlement patterns during the 20th century, as Punjabi Canadians continued to seek employment in the provincial forestry sector at sawmills throughout Vancouver Island and the Interior. During the period between 1981 and 1996, small towns including Fort St. James (South Asians formed 22 percent of the total population), Quesnel (14 percent), Lake Cowichan (13 percent), Merritt (13 percent), Williams Lake (12 percent), Tahsis (10 percent), Golden (10 percent), 100 Mile House (10 percent), Squamish (9 percent), and Lillooet (9 percent) had the largest South Asian concentrations in Canada.[90][91][92][93][94][95]
Starting in the 1980s, South Asians arriving directly from the Indian subcontinent began to increase as well. In 1985 around 15,000 immigrants arrived annually from South Asia; by 2012, that number had increased to 46,000. In addition to the South Asians still arriving from other parts of the world like the Persian Gulf, the Caribbean, the African Great Lakes, and Fiji. As a result, the South Asian community began forming growing enclaves particularly in the Vancouver and Toronto area. Some notable areas are Gerrard Street, Brampton and several neighborhoods in Mississauga, Scarborough, Markham, and Etobicoke in the Greater Toronto Area. In British Columbia notable South Asian districts include South Vancouver, Surrey, Delta, and Abbotsford.[96][97][98][99]
In 1986, following the British Columbia provincial election, Moe Sihota became the first Canadian of South Asian ancestry to be elected to a provincial parliament. Sihota, who was born in Duncan, British Columbia in 1955, ran as the NDP candidate in the riding of Esquimalt-Port Renfrew after earlier involvement in municipal politics, having been elected as an Alderman for the city of Esquimalt in 1984.[100][101][102]
The rise of the Khalistan movement, the secessionist movement that sought to make the Indian state of Punjab a separate nation for Sikhs, influenced political mobilisation among Sikhs in Canada.[25]: 249 As a result, during the 1980s many Sikhs living in Canada participated in the Khalistan movement by organising protests in Canada and funding separatist groups in India.[25]: 247 [103]: 1137–8 These protests reached their peak in 1984 when the Indian Army raided the Golden Temple, followed by the assassination of then–Indian prime minister Indira Gandhi by her Sikh bodyguards and by anti-Sikh riots throughout North India.[25]: 249 Several major anti-Indian protests occurred in Calgary, Vancouver and Toronto with angry protesters forcing their way into the Indian consulate in Toronto carrying knives and smashing photos of Indira Gandhi.[25]: 249 [better source needed] On 23 June 1985, Talwinder Singh Parmar and others carried out the Air India Flight 182 bombing, which killed 329 people, and is considered the worst terrorist attack in Canadian history.[104][105][106]

Following the outbreak of the Sri Lankan civil war in 1983, many Sri Lankan Tamils sought refuge in Canada.[107][108] Sri Lanka became the sixth largest source of immigrants to Canada during the 1990s.[109][110][111] Canada is home to one of the largest Tamil diaspora populations in the Western world, numbering nearly 240,000 persons by 2021[112][113][114] primarily in Toronto and Montreal.[107] In 2006, the Liberation Tigers of Tamil Eelam (LTTE), or Tamil Tigers, was recognized as terrorist group in Canada but support for a separate Tamil state remains.[107][115]: 273
In 1990, Baltej Singh Dhillon, a Canadian Sikh challenged the traditional dress code of the RCMP in order to accommodate his turban, an article of faith worn by orthodox Sikh men.[116]: 1–3 Opponents argued that the uniform reflected Canadian tradition while proponents cited religious accommodation in the context of past Sikh military service.[20]: 319 [az] On 15 March 1990, the policy was amended to include Sikhs to serve while wearing a turban.[ba]
21st century
Beginning in the 21st century the composition of South Asian Canadians changed significantly; Sikhs had gone from making up nearly 90% of Canadian South Asians during much of the early-mid 20th century[bb] to just 28% in 2001.[bc][5][117][118][119][120] This change reflected diversity in South Asians immigration to Canada compared to the primarily Sikh and Punjabi immigrants of the early 20th century.[4] In 2006, South Asian Canadians outnumbered Chinese Canadians to become the largest visible minority group in Canada, accounting with 25% of visible minorities.[citation needed] According the 2021 Census, South Asians are the largest visible minority in Canada.[4] On 24 February 2000, Ujjal Dosanjh became the first Canadian of South Asian origin to serve as a provincial premier when he became premier of British Columbia as leader of the New Democratic Party.[bd][better source needed]
During the first decade of the 21st century, India remained the second-largest source of invited immigrants after China and followed by the Philippines. Pakistan was also among the top ten sources of invited immigrants to Canada. In addition, India was also the second-largest source of foreign students in Canada, with 28,939 Indian students in 2012, compared with 1,747 in 2000. In 2007, BAPS Shri Swaminarayan Mandir Toronto opened, becoming the largest Hindu temple in Canada. The Aga Khan Museum, built and run by Ismaili Muslims, opened in 2014. Several other notable places of worship have been built by Canadians from South Asia, including the Khalsa Darbar Gurdwara and Baitul Islam mosque.[citation needed]
South Asian Canadian culture entered the Canadian mainstream in the 21st century. Bhangra music, a genre originating in India that combines traditional Punjabi music with pop, hip hop and other Western musical styles, has grown increasingly popular throughout Canada.[citation needed] Punjabi Canadian hip hop experienced a surge of popularity among audiences in Canada and internationally beginning in the 2010s. Canadians of all backgrounds enjoy and are familiar with Bollywood.[citation needed] In 2011, the 12th International Indian Film Academy Awards were hosted in Toronto, which was home to nearly 832,000 Canadians of South Asian ancestry, one of the largest in the Western World.[citation needed] How to Be Indie, a Canadian children's television program produced by YTV, centres on the daughter of Hindu Indian immigrants living in Toronto, and has since been syndicated in the United States, United Kingdom, Israel, Latin America and elsewhere.[citation needed] The Indian Canadian comedian Russell Peters has drawn on his heritage for much of his comedic as material.[citation needed]
In the 2015 Canadian federal election, 16 South Asian Members of Parliament (MPs) were elected from Ontario alone, the highest in Canadian history;[121] four South Asian ministers were appointed to the Canadian cabinet, including former Minister of National Defence, Harjit Sajjan.[122]
The Bangladeshi diaspora in Canada, numbering 75,425 in 2021 (2.93% of South Asian Canadians), contributes to local economies and community leadership.[123][citation needed]
In the 2020s, anti-South Asian sentiment and hate incidents surged across the country.[124]
Culture
Sports

Canadian cricket, which declined in the late 19th century, has largely been revived by members of the Commonwealth diaspora such as South Asian Canadians.[125] This has led to the American Major League Cricket considering including a team from one of the Canadian cities with a substantial South Asian population.[126]
In 2013, the Quebec Soccer Federation banned Sikh players in turbans from participating in matches, citing turbans were a health hazard, despite the practice being permitted in India.[127] This move created controversy within the Sikh community in Canada, was condemned by FIFA, and was ultimately reversed.[128]
Demography
Population

| Year | Population | % of total population |
|---|---|---|
| 1871 [24][23][d] |
11 | 0.0003% |
| 1901 [20] |
>100 | 0.002% |
| 1908 [35][37][21] |
5,179 | 0.078% |
| 1911 [52]: 354 [35] |
2,342 | 0.032% |
| 1921 [52]: 356 [35] |
1,016 | 0.012% |
| 1931 [55]: 503 [35] |
1,400 | 0.013% |
| 1941 [56]: 272 [57]: 2 [35] |
1,465 | 0.013% |
| 1951 [58]: 484 [35] |
2,148 | 0.015% |
| 1961 [59]: 5 [35] |
6,774 | 0.037% |
| 1971 [60]: 2 [35] |
67,925 | 0.315% |
| 1981 [61]: 7 [62]: 68 |
223,235 | 0.927% |
| 1986 [63]: 34 [62]: 31 |
314,305 | 1.256% |
| 1991 [65]: 68 [66]: 11 |
505,515 | 1.873% |
| 1996 [67] |
723,345 | 2.536% |
| 2001 [68] |
963,190 | 3.25% |
| 2006 [69] |
1,316,770 | 4.215% |
| 2011 [70] |
1,615,925 | 4.919% |
| 2016 [71] |
1,963,330 | 5.697% |
| 2021 [1] |
2,571,400 | 7.078% |
Reports on Canadians from India in 1908 indicated the East-Indian Canadian population was 5,179.[37][21] The overwhelming majority of whom were Sikh, male, and settled in British Columbia. However, as a result of laws which restricted the immigration the community had declined to only 1,100 by the mid-1920s. By 1961, right before racial restriction were respectfully removed from Canada's immigration policy, Canadians of South Asian descent rose to 6,774. With racial quotas being removed (invitations extended) during the 1960s the number of Canadians of South Asian ancestry created the diverse population we see into the present day.
According to the 2021 census, 2,322,895 Canadians had South Asian origins and 2,571,400 other Canadians were classified as belonging to the visible minority group, generally termed, South Asian.[1][129] The growth of the population is mainly attributed to sustained invitations of immigration from South Asian nations. According to a 2022 study conducted by Statistics Canada, Canadians with South Asian ancestry will grow to between 4.7 and 6.5 million by 2041 or 11.0 to 12.5 percent of the Canadian population overall.[130][131]
National origins
| National origin | 2021[1][129] | 2016[71] | 2011[70] | 2006[69] | 2001[68] | 1996[67] | |||||||||||||
|---|---|---|---|---|---|---|---|---|---|---|---|---|---|---|---|---|---|---|---|
| Pop. | % | Pop. | % | Pop. | % | Pop. | % | Pop. | % | Pop. | % | ||||||||
| India[be] | 1,858,755 | 72.29% | 1,582,215 | 80.59% | 1,321,360 | 81.77% | 1,072,380 | 81.44% | 813,730 | 84.48% | 638,345 | 88.25% | |||||||
| Pakistan | 303,260 | 11.79% | 215,560 | 10.98% | 155,310 | 9.61% | 124,730 | 9.47% | 74,015 | 7.68% | 38,655 | 5.34% | |||||||
| Sri Lanka | 144,490 | 5.62% | 152,595 | 7.77% | 139,415 | 8.63% | 103,625 | 7.87% | 61,315 | 6.37% | 46,585 | 6.44% | |||||||
| Bangladesh | 75,425 | 2.93% | 45,940 | 2.34% | 34,205 | 2.12% | 24,595 | 1.87% | 13,080 | 1.36% | 6,955 | 0.96% | |||||||
| Nepal | 21,975 | 0.85% | 17,140 | 0.87% | 9,780 | 0.61% | 3,780 | 0.29% | 1,170 | 0.12% | N/a | N/a | |||||||
| Bhutan | 3,215 | 0.13% | 3,600 | 0.18% | N/a | N/a | N/a | N/a | N/a | N/a | N/a | N/a | |||||||
| Total South Asian Canadian population | 2,571,400 | 100% | 1,963,330 | 100% | 1,615,925 | 100% | 1,316,770 | 100% | 963,190 | 100% | 723,345 | 100% | |||||||
| Note: Totals greater than 100% due to multiple origin responses | |||||||||||||||||||
Religion

Until the 1950s, Sikhs formed up to 95% of the entire South Asian Canadian population.[25][bf] The 2011 Canadian census marked the first time in census records where Hindus formed the largest religious group amongst Canadians of South Asian ancestry.[132]
A report detailing the religious proportion breakdown of the South Asian Canadian community was done between 2005 and 2007 by Statistics Canada, with results derived from the 2001 Canadian census and a following survey[5][117][118] which found that Canadians of South Asian ancestry were 28% Sikh, 28% Hindu, 22% Muslim and 16% Christian, and 4% irreligious.[bc] Other religious such as Jainism, Buddhism, and Zoroastrianism practiced by Canadians of South Asian heritage formed the remaining 2%. The irreligious proportion of 4% among South Asian Canadians is statistically significant, as this figure climbs to approximately 17% when surveying all Canadians.[bc]
Religious affiliation in the South Asian Canadian community varies greatly based on national background. Based on a 2007 report, Indo-Canadians are split between Sikhs (34%) and Hindus (27%), Muslims (17%), Christians (16%), Irreligious (4%), with Jains, Buddhists, and Zoroastrians forming the remaining 2%.[133] The majority of Pakistani Canadians (90%) and Bangladeshi Canadians (87%) profess to follow Islam,[bg] while the majority of Sri Lankan Canadians are Hindu (64%)[bh] with a significant minority following Christianity. Nepalese Canadians tend to mostly follow Hinduism with few of them following Buddhism. Additionally, religious distributions among certain South Asian Canadian ethnic groups also vary; 80% of Tamil Canadians are adherents of Hinduism,[bh] a large majority of Punjabi Canadians (86%) are Sikh,[bi] while most Bengali Canadians (74%) are Muslim.[bg]
| Religious group | 2021[2] | 2011[132] | 2001[119][120] | 1991[134]: 209 | 1981[135]: 40 | |||||
|---|---|---|---|---|---|---|---|---|---|---|
| Pop. | % | Pop. | % | Pop. | % | Pop. | % | Pop. | % | |
| Hinduism | 768,785 | 29.9% | 455,840 | 29.1% | 260,535 | 28.4% | 120,585 | 28.7% | 53,490 | 27.2% |
| Sikhism | 761,960 | 29.6% | 447,330 | 28.5% | 272,220 | 29.7% | 134,790 | 32.1% | 61,785 | 31.5% |
| Islam | 595,085 | 23.1% | 383,365 | 24.5% | 212,805 | 23.2% | 90,890 | 21.6% | 41,310 | 21% |
| Christianity | 245,035 | 9.5% | 185,345 | 11.8% | 124,320 | 13.6% | 54,960 | 13.1% | 29,760 | 15.2% |
| Irreligion | 156,855 | 6.1% | 67,405 | 4.3% | 30,610 | 3.3% | 12,095 | 2.9% | 6,045 | 3.1% |
| Buddhism | 27,885 | 1.1% | 17,685 | 1.1% | 8,630 | 0.9% | 2,960 | 0.7% | 1,020 | 0.5% |
| Jainism | 8,100 | 0.3% | N/a | N/a | 2,385 | 0.3% | N/a | N/a | N/a | N/a |
| Zoroastrianism | 3,630 | 0.1% | N/a | N/a | 2,900 | 0.3% | N/a | N/a | N/a | N/a |
| Judaism | 1,270 | 0.05% | 1,105 | 0.07% | 660 | 0.07% | 70 | 0.02% | 100 | 0.05% |
| Baháʼí | 440 | 0.02% | N/a | N/a | 400 | 0.04% | 80 | 0.02% | 15 | 0.01% |
| Indigenous | 115 | 0.004% | N/a | N/a | 585 | 0.1% | N/a | N/a | N/a | N/a |
| Other | 2,240 | 0.1% | 9,325 | 0.6% | 1,025 | 0.1% | 3,865 | 0.9% | 105 | 0.1% |
| Total responses | 2,571,400 | 100% | 1,567,400 | 97% | 917,075 | 95.2% | 420,295 | 83.1% | 196,395 | 88% |
| Total South Asian Canadian population | 2,571,400 | 100% | 1,615,920 | 100% | 963,190 | 100% | 505,515 | 100% | 223,235 | 100% |
Provinces and territories
Religious affiliation amongst Canadians of South Asian ancestry varies greatly by province and territory. For example, in British Columbia, adherents of Sikhism are the largest religious group amongst the South Asian community, a legacy of chain migration stemming from nearly 130 years of settlement and immigration to the western province. Conversely, in Ontario, adherents of Hinduism and Islam are more prevalent amongst the South Asian community, reflecting the religious diversity of South Asia through more recent settlement and immigration waves.
.jpg)
| Province/territory | Hinduism | Sikhism | Islam | Christianity | Irreligion | Buddhism | Jainism | Others[bj] | Total | |||||||||
|---|---|---|---|---|---|---|---|---|---|---|---|---|---|---|---|---|---|---|
| Pop. | % | Pop. | % | Pop. | % | Pop. | % | Pop. | % | Pop. | % | Pop. | % | Pop. | % | Pop. | % | |
| Ontario | 529,200 | 34.92% | 296,215 | 19.55% | 412,500 | 27.22% | 169,100 | 11.16% | 81,200 | 5.36% | 16,045 | 1.06% | 6,050 | 0.4% | 4,990 | 0.33% | 1,515,295 | 58.93% |
| British Columbia | 75,935 | 16.02% | 287,940 | 60.75% | 44,690 | 9.43% | 21,740 | 4.59% | 38,560 | 8.14% | 3,100 | 0.65% | 720 | 0.15% | 1,275 | 0.27% | 473,970 | 18.43% |
| Alberta | 74,420 | 25% | 102,520 | 34.44% | 72,005 | 24.19% | 25,020 | 8.41% | 17,820 | 5.99% | 4,510 | 1.52% | 570 | 0.19% | 780 | 0.26% | 297,650 | 11.58% |
| Quebec | 43,755 | 34.18% | 22,510 | 17.59% | 35,880 | 28.03% | 13,705 | 10.71% | 9,860 | 7.7% | 1,680 | 1.31% | 260 | 0.2% | 340 | 0.27% | 127,995 | 4.98% |
| Manitoba | 17,510 | 24.59% | 35,125 | 49.32% | 8,630 | 12.12% | 4,815 | 6.76% | 3,685 | 5.17% | 1,185 | 1.66% | 195 | 0.27% | 80 | 0.11% | 71,215 | 2.77% |
| Saskatchewan | 13,795 | 30.84% | 8,860 | 19.81% | 15,040 | 33.63% | 4,050 | 9.06% | 2,025 | 4.53% | 745 | 1.67% | 160 | 0.36% | 50 | 0.11% | 44,725 | 1.74% |
| Nova Scotia | 8,145 | 37.62% | 4,605 | 21.27% | 2,755 | 12.73% | 3,625 | 16.74% | 2,015 | 9.31% | 345 | 1.59% | 95 | 0.44% | 70 | 0.32% | 21,650 | 0.84% |
| New Brunswick | 3,180 | 36.85% | 1,725 | 19.99% | 1,605 | 18.6% | 1,175 | 13.62% | 760 | 8.81% | 90 | 1.04% | 20 | 0.23% | 80 | 0.93% | 8,630 | 0.34% |
| Newfoundland and Labrador | 1,150 | 25.27% | 845 | 18.57% | 1,240 | 27.25% | 755 | 16.59% | 435 | 9.56% | 100 | 2.2% | 10 | 0.22% | 10 | 0.22% | 4,550 | 0.18% |
| Prince Edward Island | 1,190 | 31.82% | 1,130 | 30.21% | 320 | 8.56% | 750 | 20.05% | 265 | 7.09% | 65 | 1.74% | 15 | 0.4% | 10 | 0.27% | 3,740 | 0.15% |
| Yukon | 260 | 25.12% | 385 | 37.2% | 130 | 12.56% | 150 | 14.49% | 105 | 10.14% | 0 | 0% | 0 | 0% | 0 | 0% | 1,035 | 0.04% |
| Northwest Territories | 195 | 25.16% | 110 | 14.19% | 225 | 29.03% | 130 | 16.77% | 95 | 12.26% | 10 | 1.29% | 0 | 0% | 10 | 1.29% | 775 | 0.03% |
| Nunavut | 55 | 30.56% | 10 | 5.56% | 65 | 36.11% | 20 | 11.11% | 30 | 16.67% | 0 | 0% | 0 | 0% | 0 | 0% | 180 | 0.01% |
| Canada | 768,785 | 29.9% | 761,960 | 29.63% | 595,085 | 23.14% | 245,035 | 9.53% | 156,855 | 6.1% | 27,885 | 1.08% | 8,100 | 0.32% | 7,695 | 0.3% | 2,571,400 | 100% |
Metropolitan areas
With the diversity in religious affiliation across the provinces and territories of Canada amongst individuals of South Asian descent, metropolitan areas follow a similar trend.
| Metropolitan area | Hinduism | Sikhism | Islam | Christianity | Irreligion | Buddhism | Jainism | Others[bj] | Total | |||||||||
|---|---|---|---|---|---|---|---|---|---|---|---|---|---|---|---|---|---|---|
| Pop. | % | Pop. | % | Pop. | % | Pop. | % | Pop. | % | Pop. | % | Pop. | % | Pop. | % | Pop. | % | |
| Toronto | 420,020 | 35.52% | 241,160 | 20.39% | 322,510 | 27.27% | 123,905 | 10.48% | 55,035 | 4.65% | 11,020 | 0.93% | 4,870 | 0.41% | 3,965 | 0.34% | 1,182,485 | 45.99% |
| Vancouver | 62,065 | 16.81% | 219,960 | 59.56% | 39,475 | 10.69% | 15,830 | 4.29% | 27,665 | 7.49% | 2,690 | 0.73% | 620 | 0.17% | 990 | 0.27% | 369,290 | 14.36% |
| Calgary | 33,340 | 21.76% | 55,500 | 36.23% | 43,355 | 28.3% | 9,705 | 6.33% | 8,940 | 5.84% | 1,700 | 1.11% | 270 | 0.18% | 385 | 0.25% | 153,205 | 5.96% |
| Edmonton | 33,710 | 27.33% | 44,020 | 35.69% | 24,310 | 19.71% | 11,720 | 9.5% | 6,880 | 5.58% | 2,230 | 1.81% | 240 | 0.19% | 225 | 0.18% | 123,335 | 4.8% |
| Montreal | 42,285 | 34.87% | 22,185 | 18.3% | 34,670 | 28.59% | 11,875 | 9.79% | 8,160 | 6.73% | 1,540 | 1.27% | 260 | 0.21% | 280 | 0.23% | 121,260 | 4.72% |
| Winnipeg | 14,160 | 22.19% | 33,105 | 51.88% | 8,070 | 12.65% | 3,815 | 5.98% | 3,275 | 5.13% | 1,165 | 1.83% | 155 | 0.24% | 65 | 0.1% | 63,810 | 2.48% |
| Ottawa–Gatineau | 20,480 | 33.7% | 6,520 | 10.73% | 17,790 | 29.27% | 7,645 | 12.58% | 6,400 | 10.53% | 1,385 | 2.28% | 280 | 0.46% | 295 | 0.49% | 60,780 | 2.36% |
| Kitchener–Cambridge–Waterloo | 18,180 | 32.87% | 12,095 | 21.87% | 15,615 | 28.23% | 5,180 | 9.37% | 3,275 | 5.92% | 605 | 1.09% | 220 | 0.4% | 130 | 0.24% | 55,305 | 2.15% |
| Abbotsford–Mission | 3,860 | 7.74% | 41,325 | 82.92% | 1,105 | 2.22% | 1,205 | 2.42% | 2,290 | 4.59% | 40 | 0.08% | 0 | 0% | 20 | 0.04% | 49,840 | 1.94% |
| Hamilton | 13,895 | 29.17% | 9,400 | 19.73% | 14,125 | 29.65% | 5,685 | 11.93% | 3,450 | 7.24% | 730 | 1.53% | 210 | 0.44% | 135 | 0.28% | 47,635 | 1.85% |
| Oshawa | 14,680 | 39.07% | 1,510 | 4.02% | 12,665 | 33.71% | 5,945 | 15.82% | 2,185 | 5.82% | 440 | 1.17% | 80 | 0.21% | 65 | 0.17% | 37,570 | 1.46% |
| London | 8,765 | 30.99% | 4,195 | 14.83% | 6,535 | 23.1% | 6,000 | 21.21% | 1,925 | 6.81% | 630 | 2.23% | 115 | 0.41% | 120 | 0.42% | 28,285 | 1.1% |
| Windsor | 7,045 | 34.22% | 4,325 | 21.01% | 6,235 | 30.29% | 1,605 | 7.8% | 1,125 | 5.47% | 195 | 0.95% | 35 | 0.17% | 20 | 0.1% | 20,585 | 0.8% |
| Regina | 6,435 | 33.02% | 4,380 | 22.47% | 6,010 | 30.84% | 1,480 | 7.59% | 785 | 4.03% | 255 | 1.31% | 115 | 0.59% | 20 | 0.1% | 19,490 | 0.76% |
| Saskatoon | 5,165 | 26.66% | 3,275 | 16.9% | 8,100 | 41.81% | 1,510 | 7.79% | 845 | 4.36% | 435 | 2.25% | 30 | 0.15% | 15 | 0.08% | 19,375 | 0.75% |
| Halifax | 6,620 | 39.29% | 3,480 | 20.65% | 2,465 | 14.63% | 2,440 | 14.48% | 1,440 | 8.55% | 265 | 1.57% | 90 | 0.53% | 45 | 0.27% | 16,850 | 0.66% |
| Victoria | 2,965 | 21.61% | 5,135 | 37.43% | 1,270 | 9.26% | 1,330 | 9.69% | 2,700 | 19.68% | 170 | 1.24% | 50 | 0.36% | 95 | 0.69% | 13,720 | 0.53% |
| St. Catharines–Niagara | 3,245 | 25.42% | 2,110 | 16.53% | 3,580 | 28.05% | 2,250 | 17.63% | 1,285 | 10.07% | 170 | 1.33% | 100 | 0.78% | 20 | 0.16% | 12,765 | 0.5% |
| Guelph | 3,830 | 33.55% | 2,460 | 21.55% | 2,785 | 24.4% | 1,230 | 10.78% | 740 | 6.48% | 255 | 2.23% | 55 | 0.48% | 55 | 0.48% | 11,415 | 0.44% |
| Barrie | 2,535 | 32.17% | 1,260 | 15.99% | 2,060 | 26.14% | 1,380 | 17.51% | 10 | 6.92% | 75 | 0.95% | 10 | 0.13% | 10 | 0.13% | 7,880 | 0.31% |
| Canada | 768,785 | 29.9% | 761,960 | 29.63% | 595,085 | 23.14% | 245,035 | 9.53% | 156,855 | 6.1% | 27,885 | 1.08% | 8,100 | 0.32% | 7,695 | 0.3% | 2,571,400 | 100% |
Language
Knowledge of language
.jpg)
Many South Asian Canadians speak Canadian English or Canadian French as a first language, as many multi-generational individuals do not speak South Asian languages as a mother tongue, but instead may speak one or multiple[bk] as a second or third language.
According to the 2021 census, South Asian languages with the largest number of speakers in Canada include Hindustani (1,176,295 persons or 3.2 percent of the national population),[bl] Punjabi (942,170 persons or 2.6 percent), Tamil (237,890 persons or 0.7 percent), Gujarati (209,410 persons or 0.6 percent), Bengali (120,605 persons or 0.3 percent), Malayalam (77,910 persons or 0.2 percent), Telugu (54,685 persons or 0.2 percent), Marathi (35,230 persons or 0.1 percent), and Sinhalese (33,050 persons or 0.1 percent).[112][113]
| Language | 2021[112][113][114] | 2016[136] | 2011[137][138] | |||
|---|---|---|---|---|---|---|
| Pop. | % | Pop. | % | Pop. | % | |
| Hindustani[bl] | 1,176,295 | 3.24% | 755,585 | 2.19% | 576,165 | 1.74% |
| Punjabi | 942,170 | 2.59% | 668,240 | 1.94% | 545,730 | 1.65% |
| Tamil | 237,890 | 0.65% | 189,860 | 0.55% | 179,465 | 0.54% |
| Gujarati | 209,410 | 0.58% | 149,045 | 0.43% | 118,950 | 0.36% |
| Bengali | 120,605 | 0.33% | 91,220 | 0.26% | 69,490 | 0.21% |
| Malayalam | 77,910 | 0.21% | 37,810 | 0.11% | 22,125 | 0.07% |
| Telugu | 54,685 | 0.15% | 23,160 | 0.07% | 12,645 | 0.04% |
| Marathi | 35,230 | 0.1% | 15,570 | 0.05% | 9,695 | 0.03% |
| Sinhalese | 33,050 | 0.09% | 27,825 | 0.08% | 23,965 | 0.07% |
| Pashto | 31,700 | 0.09% | 23,180 | 0.07% | 16,515 | 0.05% |
| Nepali | 30,660 | 0.08% | 21,380 | 0.06% | 11,450 | 0.03% |
| Kannada | 18,420 | 0.05% | 8,245 | 0.02% | 5,210 | 0.02% |
| Kacchi | 15,085 | 0.04% | N/a | N/a | N/a | N/a |
| Konkani | 8,950 | 0.02% | 6,790 | 0.02% | 5,785 | 0.02% |
| Sindhi | 8,385 | 0.02% | 20,260 | 0.06% | 15,525 | 0.05% |
| Oriya | 3,235 | 0.01% | 1,535 | 0.004% | N/a | N/a |
| Kashmiri | 1,830 | 0.01% | 905 | 0.003% | N/a | N/a |
| Tulu | 1,765 | 0.005% | N/a | N/a | N/a | N/a |
| Assamese | 1,155 | 0.003% | N/a | N/a | N/a | N/a |
| Baluchi | 985 | 0.003% | N/a | N/a | N/a | N/a |
| Rohingya | 765 | 0.002% | N/a | N/a | N/a | N/a |
| Other | 12,290 | 0.03% | 9,665 | 0.03% | 8,615 | 0.03% |
| Total Canada | 3,022,470 | 8.32% | 2,050,275 | 5.95% | 1,621,330 | 4.9% |
Mother tongue
| Language | 2021[113][114] | 2016[136][139] | 2011[138][140] | |||
|---|---|---|---|---|---|---|
| Pop. | % | Pop. | % | Pop. | % | |
| Punjabi | 763,785 | 2.09% | 543,495 | 1.56% | 459,990 | 1.39% |
| Hindustani[bl] | 521,990 | 1.43% | 377,025 | 1.08% | 300,400 | 0.91% |
| Tamil | 184,750 | 0.5% | 157,125 | 0.45% | 143,395 | 0.43% |
| Gujarati | 168,800 | 0.46% | 122,455 | 0.35% | 101,310 | 0.31% |
| Bengali | 104,325 | 0.28% | 80,930 | 0.23% | 64,460 | 0.19% |
| Malayalam | 66,230 | 0.18% | 32,285 | 0.09% | 17,695 | 0.05% |
| Telugu | 39,685 | 0.11% | 18,750 | 0.05% | 10,670 | 0.03% |
| Nepali | 26,365 | 0.07% | 19,290 | 0.06% | 8,945 | 0.03% |
| Pashto | 23,185 | 0.06% | 18,295 | 0.05% | 13,100 | 0.04% |
| Sinhalese | 21,985 | 0.06% | 18,365 | 0.05% | 15,685 | 0.05% |
| Marathi | 19,570 | 0.05% | 9,755 | 0.03% | 6,655 | 0.02% |
| Kacchi | 9,855 | 0.03% | N/a | N/a | N/a | N/a |
| Kannada | 9,140 | 0.02% | 4,795 | 0.01% | 3,140 | 0.01% |
| Sindhi | 5,315 | 0.01% | 13,880 | 0.04% | 12,935 | 0.04% |
| Konkani | 5,225 | 0.01% | 4,255 | 0.01% | 3,535 | 0.01% |
| Oriya | 2,305 | 0.01% | 1,210 | 0.003% | N/a | N/a |
| Kashmiri | 1,015 | 0.003% | 620 | 0.002% | N/a | N/a |
| Tulu | 910 | 0.002% | N/a | N/a | N/a | N/a |
| Assamese | 715 | 0.002% | N/a | N/a | N/a | N/a |
| Baluchi | 645 | 0.002% | N/a | N/a | N/a | N/a |
| Parsi | 635 | 0.002% | N/a | N/a | N/a | N/a |
| Rohingya | 615 | 0.002% | N/a | N/a | N/a | N/a |
| Fiji Hindi | 610 | 0.002% | N/a | N/a | N/a | N/a |
| Saraiki | 505 | 0.001% | N/a | N/a | N/a | N/a |
| Hindko | 485 | 0.001% | N/a | N/a | N/a | N/a |
| Marwari | 395 | 0.001% | N/a | N/a | N/a | N/a |
| Pashai | 345 | 0.001% | N/a | N/a | N/a | N/a |
| Saurashtra | 345 | 0.001% | N/a | N/a | N/a | N/a |
| Pahari | 255 | 0.001% | N/a | N/a | N/a | N/a |
| Sylheti[bm] | 250 | 0.001% | N/a | N/a | N/a | N/a |
| Kurux | 245 | 0.001% | N/a | N/a | N/a | N/a |
| Memoni | 240 | 0.001% | N/a | N/a | N/a | N/a |
| Haryanvi | 230 | 0.001% | N/a | N/a | N/a | N/a |
| Maithili | 230 | 0.001% | N/a | N/a | N/a | N/a |
| Chakma | 180 | 0% | N/a | N/a | N/a | N/a |
| Romani | 180 | 0% | N/a | N/a | N/a | N/a |
| Bhojpuri | 145 | 0% | N/a | N/a | N/a | N/a |
| Pahari-Pothwari | 140 | 0% | N/a | N/a | N/a | N/a |
| Dogri | 120 | 0% | N/a | N/a | N/a | N/a |
| Garhwali | 115 | 0% | N/a | N/a | N/a | N/a |
| Rajasthani | 105 | 0% | N/a | N/a | N/a | N/a |
| Kodava | 100 | 0% | N/a | N/a | N/a | N/a |
| Bishnupuriya | 90 | 0% | N/a | N/a | N/a | N/a |
| Khowar | 75 | 0% | N/a | N/a | N/a | N/a |
| Oadki | 60 | 0% | N/a | N/a | N/a | N/a |
| Other | 615 | 0.002% | 6,215 | 0.02% | 6,020 | 0.02% |
| Total Canada | 1,973,525 | 5.39% | 1,428,745 | 4.11% | 1,167,935 | 3.53% |
Generation status
A large minority of Canadians are first generation, numbering 9,606,600 people and forming 26.44% of the national population as of the 2021 Canadian census.[1] In comparison with the nationwide statistics, as of the 2021 Canadian census, a majority of the South Asian Canadian community was first generation, numbering 1,833,640 people and forming 71.31% of the total South Asian Canadian population.[1]
Similarly, a large minority of Canadians are second generation, numbering 6,393,310 people and forming 17.60% of the total national population as of the 2021 Canadian census.[1] In comparison with the nationwide statistics, as of the 2021 Canadian census, a large minority of the South Asian Canadian community was second generation, numbering 682,760 people or 26.55% of the total South Asian Canadian population.[1]
A narrow majority of Canadians are third or more generation, numbering 20,328,565 people and forming 55.96% of the total national population as of the 2021 Canadian census.[1] In comparison with the nationwide statistics, as of the 2021 Canadian census, a small minority of the South Asian Canadian community was third or more generation, numbering 55,000 people or 2.14% of the total South Asian Canadian population.[1]
|
| |||||||||||||||||||||||||||||||||||||||||||||||||||||||||||||||||||||||||||||||||||||||||||||||||||||||||||||||||||||||||||||||||||||||||||||||||||||||||||||||
Place of birth
| Region | 2021[144] | 2016[145] | 2011[146] | 2006[147] | 2001[148][149] | 1996[150] | 1986[151]: 279 | 1961[82]: 430 | 1931[53]: 245 [152]: 813 | |||||||||
|---|---|---|---|---|---|---|---|---|---|---|---|---|---|---|---|---|---|---|
| Pop. | % | Pop. | % | Pop. | % | Pop. | % | Pop. | % | Pop. | % | Pop. | % | Pop. | % | Pop. | % | |
| Southern Asia | 1,614,540 | 62.79% | 1,119,430 | 58.16% | 854,935 | 54.54% | 683,635 | 55.43% | 479,790 | 52.32% | 336,655 | 46.54% | 142,365 | 47.36% | N/a | N/a | 1,120 | 80% |
| Canada | 737,760 | 28.69% | 593,885 | 30.86% | 484,140 | 30.89% | 345,970 | 28.05% | 265,160 | 28.91% | 217,030 | 30% | 85,810 | 28.54% | 2,627 | 38.78% | 230 | 16.43% |
| Africa | 54,700 | 2.13% | 54,260 | 2.82% | 50,120 | 3.2% | 50,435 | 4.09% | 49,635 | 5.41% | 48,045 | 6.64% | 30,740 | 10.23% | N/a | N/a | N/a | N/a |
| Western Asia & Central Asia | 41,910 | 1.63% | 31,665 | 1.65% | 25,210 | 1.61% | 18,750 | 1.52% | 13,345 | 1.46% | 5,525 | 0.76% | 1,160 | 0.39% | N/a | N/a | N/a | N/a |
| Central America & South America | 27,420 | 1.07% | 33,730 | 1.75% | 36,095 | 2.3% | 36,175 | 2.93% | 29,880 | 3.26% | 39,600 | 5.47% | 15,020 | 5% | N/a | N/a | N/a | N/a |
| Northern Europe & Western Europe | 24,815 | 0.97% | 21,345 | 1.11% | 16,860 | 1.08% | 14,640 | 1.19% | 13,160 | 1.43% | 13,290 | 1.84% | 8,745 | 2.91% | N/a | N/a | N/a | N/a |
| Oceania | 19,180 | 0.75% | 23,480 | 1.22% | 22,305 | 1.42% | 21,410 | 1.74% | 20,990 | 2.29% | 15,775 | 2.18% | 5,700 | 1.9% | N/a | N/a | N/a | N/a |
| North America | 18,980 | 0.74% | 12,725 | 0.66% | 7,825 | 0.5% | 5,245 | 0.43% | 3,040 | 0.33% | 1,645 | 0.23% | 865 | 0.29% | N/a | N/a | N/a | N/a |
| Caribbean | 13,800 | 0.54% | 20,060 | 1.04% | 21,750 | 1.39% | 22,810 | 1.85% | 14,425 | 1.57% | 24,165 | 3.34% | 7,165 | 2.38% | N/a | N/a | N/a | N/a |
| Southeast Asia | 12,585 | 0.49% | 10,440 | 0.54% | 9,165 | 0.58% | 7,890 | 0.64% | 7,175 | 0.78% | 4,670 | 0.65% | 2,015 | 0.67% | N/a | N/a | N/a | N/a |
| Southern Europe | 2,505 | 0.1% | 1,150 | 0.06% | 275 | 0.02% | 345 | 0.03% | 290 | 0.03% | 200 | 0.03% | 80 | 0.03% | N/a | N/a | N/a | N/a |
| Eastern Asia | 2,405 | 0.09% | 2,035 | 0.11% | 1,710 | 0.11% | 1,075 | 0.09% | 1,185 | 0.13% | 865 | 0.12% | 425 | 0.14% | N/a | N/a | 16 | 1.14% |
| Eastern Europe | 810 | 0.03% | 415 | 0.02% | 335 | 0.02% | 185 | 0.02% | 170 | 0.02% | 75 | 0.01% | 40 | 0.01% | N/a | N/a | 11 | 0.79% |
| Other or Unspecified | 0 | 0% | 0 | 0% | 36,615 | 2.34% | 24,700 | 2% | 18,825 | 2.05% | 15,810 | 2.19% | 495 | 0.16% | 4,147 | 61.22% | 23 | 1.64% |
| Native born | 737,760 | 28.69% | 593,885 | 30.86% | 484,140 | 30.89% | 345,970 | 28.05% | 265,160 | 28.91% | 217,030 | 30% | 85,810 | 28.54% | 2,627 | 38.78% | 230 | 16.43% |
| Foreign born | 1,833,640 | 71.31% | 1,330,750 | 69.14% | 1,083,265 | 69.11% | 887,305 | 71.95% | 651,910 | 71.09% | 506,320 | 70% | 214,820 | 71.46% | 4,147 | 61.22% | 1,170 | 83.57% |
| Total responses | 2,571,400 | 100% | 1,924,635 | 98.03% | 1,567,405 | 97% | 1,233,275 | 93.66% | 917,075 | 95.21% | 723,345 | 100% | 300,630 | 95.65% | 6,774 | 100% | 1,400 | 100% |
| Total population | 2,571,400 | 100% | 1,963,330 | 100% | 1,615,925 | 100% | 1,316,770 | 100% | 963,190 | 100% | 723,345 | 100% | 314,305 | 100% | 6,774 | 100% | 1,400 | 100% |
Geographical distribution
.jpg)
Provinces and territories
According to the 2021 census provinces with the largest South Asian Canadian populations include Ontario (1,515,295 persons or 10.8 percent of the total population), British Columbia (473,970 persons or 9.6 percent), Alberta (297,650 persons or 7.1 percent), Quebec (127,995 persons or 1.5 percent) and Manitoba (71,215 persons or 5.5 percent).[1]
Canadian provinces and territories by their ethnic South Asian population as per the 2001 Canadian census, 2006 Canadian census, 2011 Canadian census, 2016 Canadian census, and 2021 Canadian census below.
| Province/territory | 2021[1] | 2016[71] | 2011[70] | 2006[69] | 2001[68] | |||||
|---|---|---|---|---|---|---|---|---|---|---|
| Pop. | % | Pop. | % | Pop. | % | Pop. | % | Pop. | % | |
| Ontario | 1,515,295 | 10.8% | 1,182,845 | 8.93% | 1,003,180 | 7.93% | 833,315 | 6.93% | 592,500 | 5.25% |
| British Columbia | 473,970 | 9.64% | 365,705[153] | 8.02% | 313,440[154] | 7.25% | 265,595 | 6.52% | 210,420 | 5.44% |
| Alberta | 297,650 | 7.12% | 231,550 | 5.82% | 159,055 | 4.46% | 107,690 | 3.31% | 72,415 | 2.46% |
| Quebec | 127,995 | 1.54% | 95,670 | 1.2% | 91,395 | 1.18% | 76,990 | 1.04% | 62,585 | 0.88% |
| Manitoba | 71,215 | 5.45% | 43,150 | 3.48% | 26,220 | 2.23% | 17,800 | 1.57% | 14,135 | 1.28% |
| Saskatchewan | 44,725 | 4.05% | 29,960[155] | 2.8% | 12,620 | 1.25% | 5,510 | 0.58% | 4,220 | 0.44% |
| Nova Scotia | 21,650 | 2.26% | 8,495 | 0.94% | 5,935 | 0.65% | 4,830 | 0.53% | 3,515 | 0.39% |
| New Brunswick | 8,630 | 1.14% | 2,970 | 0.41% | 3,090 | 0.42% | 2,560 | 0.36% | 1,720 | 0.24% |
| Newfoundland and Labrador | 4,550 | 0.91% | 2,740 | 0.53% | 2,000 | 0.39% | 1,755 | 0.35% | 1,110 | 0.22% |
| Prince Edward Island | 3,740 | 2.49% | 975 | 0.7% | 500 | 0.36% | 255 | 0.19% | 140 | 0.1% |
| Northwest Territories | 775 | 1.92% | 615 | 1.5% | 200 | 0.49% | 210 | 0.51% | 200 | 0.54% |
| Yukon | 1,035 | 2.61% | 500[156] | 1.42% | 365[157] | 1.1% | 200 | 0.66% | 205 | 0.72% |
| Nunavut | 180 | 0.49% | 130 | 0.37% | 115 | 0.36% | 85[158] | 0.29% | 30 | 0.11% |
| Canada | 2,571,400 | 7.08% | 1,963,330 | 5.7% | 1,615,925 | 4.92% | 1,316,770 | 4.21% | 963,190 | 3.25% |
With immigration restrictions for non-European origin ethnocultural groups lifting during the 1960s, the South Asian Canadian population witnessed rapid growth in the mid-late 20th century, increasing from 67,925 persons or 0.3% of the total Canadian population in 1971 to 723,345 persons or 2.5% of the total Canadian population in 1996; this growth was primarily attributed to mass immigration.
Attributed to the large increase in immigration during the era, Ontario overtook British Columbia by 1971 as the province with the largest population of individuals with South Asian ancestry in Canada. The South Asian population in Ontario grew from 30,920 persons in 1971 to 427,470 persons by 1996; in British Columbia from 18,795 persons in 1971 to 165,010 persons by 1996.
During the same era, British Columbia would continue to be the province with the largest proportion of South Asian Canadians, increasing from 0.9% in 1971 to 4.5% by 1996, while the South Asian Canadian share of the total population in Ontario grew from 0.4% in 1971 to 4.0% by 1996.
Canadian provinces and territories by their ethnic South Asian population as per the 1971 Canadian census, 1981 Canadian census, 1986 Canadian census, 1991 Canadian census and 1996 Canadian census below.
| Province/territory | 1996[67] | 1991[65]: 68 | 1986[63]: 34 | 1981[61]: 7 | 1971[60]: 2 | |||||
|---|---|---|---|---|---|---|---|---|---|---|
| Pop. | % | Pop. | % | Pop. | % | Pop. | % | Pop. | % | |
| Ontario | 427,470 | 4.02% | 285,600[159] | 2.86% | 161,395 | 1.79% | 93,990 | 1.1% | 30,920 | 0.4% |
| British Columbia | 165,010 | 4.47% | 118,200[159] | 3.64% | 78,810 | 2.77% | 56,210 | 2.07% | 18,795 | 0.86% |
| Alberta | 56,195 | 2.11% | 46,095 | 1.83% | 34,645 | 1.48% | 21,440 | 0.97% | 4,400 | 0.27% |
| Quebec | 50,645 | 0.72% | 34,305 | 0.5% | 21,485 | 0.33% | 14,150 | 0.22% | 6,510 | 0.11% |
| Manitoba | 12,905 | 1.17% | 10,870 | 1.01% | 8,855 | 0.84% | 5,055 | 0.5% | 3,205 | 0.32% |
| Saskatchewan | 3,985 | 0.41% | 3,695 | 0.38% | 4,165 | 0.42% | 2,200 | 0.23% | 1,625 | 0.18% |
| Nova Scotia | 3,810 | 0.42% | 2,790 | 0.31% | 2,450 | 0.28% | 1,685 | 0.2% | 1,345 | 0.17% |
| New Brunswick | 1,565 | 0.21% | 975 | 0.14% | 950 | 0.14% | 720 | 0.1% | 465 | 0.07% |
| Newfoundland and Labrador | 1,060 | 0.19% | 1,090 | 0.19% | 860 | 0.15% | 725 | 0.13% | 460 | 0.09% |
| Prince Edward Island | 195 | 0.15% | 210 | 0.16% | 255 | 0.2% | 75 | 0.06% | 135 | 0.12% |
| Northwest Territories | 280[bn] | 0.44% | 220[bn] | 0.38% | 100[bn] | 0.19% | 55[bn] | 0.12% | 55[bn] | 0.16% |
| Yukon | 225 | 0.73% | 80 | 0.29% | 70 | 0.3% | 85 | 0.37% | 15 | 0.08% |
| Canada | 723,345 | 2.54% | 505,515[66]: 11 | 1.87% | 314,305[62]: 31 | 1.26% | 223,235[62]: 68 | 0.93% | 67,925 | 0.31% |
Immigration restrictions prior to the 1960s severely limited South Asian population growth in Canada. British Columbia was the only province to have notable populations during the early-to-mid 20th century, peaking in 1908 with approximately 5,209 persons, forming 1.6% of the provincial population.
Tightened immigration restrictions, heightened racial tensions, along with migration to the United States or a return to the subcontinent prompted a population decline in the following years; the 1911 census counted 2,292 persons of South Asian ancestry in British Columbia, comprising 0.6% of provincial population.
This was followed by another population decline in the ensuing 10 years with 951 persons of South Asian ancestry in British Columbia or 0.2% of the total population in 1921. During the ensuing 30 years, a population stagnation followed by a slow gradual increase in the South Asian Canadian population principally stemmed from natural growth, as immigration from the subcontinent has been essentially halted since 1908 due to the Continuous journey regulation.
In the 1950s, country quotas were introduced and permitted sponsorship of relatives, thus resulting in the first relatively major increase in the South Asian Canadian population since prior to 1908.
Canadian provinces and territories by their ethnic South Asian population as per the 1871 Canadian census, 1911 Canadian census, 1921 Canadian census, 1931 Canadian census, 1941 Canadian census, 1951 Canadian census, and 1961 Canadian census below.
| Province/territory | 1961[59]: 5 | 1951[58]: 484 | 1941[56]: 272 [57]: 2 | 1931[55]: 503 | 1921[52]: 356 | 1911[38][52]: 354 | 1871[24][23][d] | |||||||
|---|---|---|---|---|---|---|---|---|---|---|---|---|---|---|
| Pop. | % | Pop. | % | Pop. | % | Pop. | % | Pop. | % | Pop. | % | Pop. | % | |
| British Columbia | 4,526 | 0.28% | 1,937 | 0.17% | 1,343 | 0.16% | 1,283 | 0.18% | 951 | 0.18% | 2,292 | 0.58% | N/a | N/a |
| Ontario | 1,155 | 0.02% | 76 | 0% | 21 | 0% | 43 | 0% | 28 | 0% | 17 | 0% | 8 | 0% |
| Quebec | 483 | 0.01% | 61 | 0% | 29 | 0% | 17 | 0% | 11 | 0% | 14 | 0% | 0 | 0% |
| Alberta | 208 | 0.02% | 27 | 0% | 48 | 0.01% | 33 | 0% | 10 | 0% | 3 | 0% | N/a | N/a |
| Manitoba | 198 | 0.02% | 15 | 0% | 7 | 0% | 13 | 0% | 8 | 0% | 13 | 0% | N/a | N/a |
| Saskatchewan | 115 | 0.01% | 5 | 0% | 2 | 0% | 7 | 0% | 6 | 0% | 0 | 0% | N/a | N/a |
| Nova Scotia | 46 | 0.01% | 23 | 0% | 15 | 0% | 3 | 0% | 0 | 0% | 0 | 0% | 3 | 0% |
| New Brunswick | 22 | 0% | 1 | 0% | 0 | 0% | 1 | 0% | 1 | 0% | 2 | 0% | 0 | 0% |
| Newfoundland and Labrador | 17 | 0% | 2 | 0% | N/a[bo] | N/a | N/a[bo] | N/a | N/a[bo] | N/a | N/a[bo] | N/a | N/a[bo] | N/a |
| Northwest Territories | 2[bn] | 0.01% | 1[bn] | 0.01% | 0[bn] | 0% | 0[bn] | 0% | 0 | 0% | 0 | 0% | N/a | N/a |
| Prince Edward Island | 1 | 0% | 0 | 0% | 0 | 0% | 0 | 0% | 0 | 0% | 0 | 0% | N/a | N/a |
| Yukon | 1 | 0.01% | 0 | 0% | 0 | 0% | 0 | 0% | 1 | 0.02% | 1 | 0.01% | N/a | N/a |
| Canada | 6,774 | 0.04% | 2,148 | 0.02% | 1,465 | 0.01% | 1,400 | 0.01% | 1,016 | 0.01% | 2,342 | 0.03% | 11 | 0.0003% |
Metropolitan areas
According to the 2021 census, metropolitan areas with large South Asian Canadian communities include Toronto (1,182,485), Vancouver (369,295), Calgary (153,200), Edmonton (123,340), Montréal (121,260), Winnipeg (63,805), and Ottawa (60,780).[1]
Canadian metropolitan areas by their ethnic South Asian population as per the 2011 Canadian census, 2016 Canadian census, and 2021 Canadian census below.
| Metro area | Province | 2021[1] | 2016[71] | 2011[70] | |||
|---|---|---|---|---|---|---|---|
| Pop. | % | Pop. | % | Pop. | % | ||
| Toronto | Ontario | 1,182,485 | 19.25% | 995,125 | 16.97% | 833,080 | 15.09% |
| Vancouver | British Columbia | 369,295 | 14.17% | 291,005[160] | 11.99% | 252,400 | 11.07% |
| Calgary | Alberta | 153,200 | 10.46% | 122,900[161] | 8.94% | 84,870 | 7.08% |
| Edmonton | Alberta | 123,340 | 8.82% | 91,600 | 7.06% | 61,135 | 5.36% |
| Montreal | Quebec | 121,260 | 2.88% | 90,815 | 2.26% | 79,540 | 2.12% |
| Winnipeg | Manitoba | 63,805 | 7.78% | 38,910 | 5.11% | 23,175 | 3.24% |
| Ottawa-Gatineau | Ontario-Quebec | 60,780 | 4.15% | 42,310 | 3.25% | 34,790 | 2.86% |
| Kitchener-Cambridge-Waterloo | Ontario | 55,305 | 9.74% | 27,525 | 5.33% | 20,910 | 4.45% |
| Abbotsford-Mission | British Columbia | 49,835 | 25.94% | 38,250[160] | 21.69% | 32,245 | 19.35% |
| Hamilton | Ontario | 47,630 | 6.16% | 32,720 | 4.45% | 23,765 | 3.36% |
Subdivisions
According to the 2021 census, subdivisions with the largest South Asian Canadian communities include Brampton, Ontario (52.4%); Surrey, British Columbia (37.8%); Abbotsford, British Columbia (30.2%); Milton, Ontario (28.2%); Ajax, Ontario (26.2%); Delta, British Columbia (26.1%); Mississauga, Ontario (25.4%); Caledon, Ontario (21.4%); Pickering, Ontario (21.2%); and Chestermere, Alberta (20.3%).[162] As of the 2021 census, Brampton is the first (and only) South Asian–majority city in Canada.
Source: 2021 Canadian census[162]
National average: 7.1%[bp]
Alberta
- Chestermere (20.3%)
- Edmonton (11.5%)
- Calgary (11.0%)
- Beaumont (7.8%)
British Columbia
- Surrey (37.8%)
- Abbotsford (30.2%)
- Delta (26.1%)
- Okanagan-Similkameen Subdivision A (15.8%)[bq]
- Okanagan-Similkameen Subdivision C (14.5%)[br]
- Cawston (12.7%)
- Fraser Valley Subdivision G (12.1%)
- Mission (10.7%)
- New Westminster (10.4%)
- Burnaby (9.4%)
- Oliver (9.4%)
- McBride (8.0%)
- White Rock (7.6%)
- Richmond (7.4%)
- Fraser Valley Subdivision F (7.3%)
 Forming 37.8% of the population, Surrey has the highest percentage of South Asian Canadians in British Columbia.
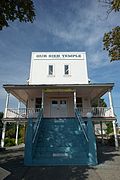 Forming 30.2% of the population, Abbotsford has the second-highest percentage of South Asian Canadians in British Columbia.
 Forming 26.1% of the population, Delta has the third-highest percentage of South Asian Canadians in British Columbia.
 Forming 15.8% of the population, Okanagan-Similkameen Subdivision A[bq] has the fourth-highest percentage of South Asian Canadians in British Columbia.
 Forming 14.5% of the population, Okanagan-Similkameen Subdivision C[br] has the fifth-highest percentage of South Asian Canadians in British Columbia.


.jpg)


Historical
| Subdivision | Regional district | Percentage | |||
|---|---|---|---|---|---|
| 1981[90][91] | 1986[92] | 1991[93] | 1996[94][95][163][164] | ||
| Fort St. James | Bulkley-Nechako | 15.44% | 16.92% | 21.59% | 19.8% |
| Quesnel | Cariboo | 14.2% | 13.68% | 12.84% | 13.73% |
| Lake Cowichan | Cowichan Valley | 12.73% | 7.32% | 4.69% | 0.53% |
| Merritt | Thompson-Nicola | 11.65% | 13.19% | 10.53% | 9.41% |
| Tahsis | Comox-Strathcona | 10.34% | 12.54% | 8.26% | 1.05% |
| Williams Lake | Cariboo | 10.15% | 11.51% | 10.08% | 9.9% |
| 100 Mile House | Cariboo | 9.55% | 3.35% | 6.1% | 2.48% |
| Lillooet | Squamish-Lillooet | 8.86% | 5.95% | 5.98% | 0.51% |
| Golden | Columbia-Shuswap | 6.59% | 9.8% | 9.21% | 6.35% |
| Elkford | East Kootenay | 6.1% | 7.22% | 5.99% | 8.21% |
| Port Alberni | Alberni-Clayoquot | 5.57% | 6.46% | 5.61% | 6.38% |
| Houston | Bulkley-Nechako | 5.23% | 8.19% | 7.02% | 7.38% |
| Squamish | Squamish-Lillooet | 4.75% | 5.58% | 5.96% | 8.93% |
| Terrace | Kitimat-Stikine | 4.45% | 4.16% | 6.09% | 4.58% |
| Mackenzie | Fraser-Fort George | 4.24% | 5.86% | 5.01% | 4.43% |
| Thompson-Nicola Subdivision A[bs] | Thompson-Nicola | 4.24% | 3.81% | 3.54% | 1.81% |
| Kitimat | Kitimat-Stikine | 4.24% | 6.02% | 5.85% | 3.87% |
| Vanderhoof | Bulkley-Nechako | 4.18% | 2.03% | 3.01% | 2.18% |
| North Cowichan | Cowichan Valley | 4.1% | 4.88% | 3.76% | 3.82% |
| Sparwood | East Kootenay | 3.36% | 3.41% | 3.39% | 1.01% |
| Campbell River | Comox-Strathcona | 2.99% | 2.28% | 1.33% | 1.79% |
| Prince Rupert | North Coast | 2.51% | 3.1% | 2.63% | 3.76% |
| Ladysmith | Cowichan Valley | 2.41% | 2.28% | 1.03% | 0.39% |
| Port Hardy | Mount Waddington | 2.24% | 3.34% | 1.67% | 0.76% |
| Kamloops | Thompson-Nicola | 1.86% | 2.47% | 1.88% | 2.29% |
| Port McNeil | Mount Waddington | 1.84% | 1.4% | 2.05% | 0% |
| Prince George | Fraser-Fort George | 1.69% | 2.21% | 2.34% | 2.32% |
| Midway | Kootenay Boundary | 1.43% | 7.94% | 0% | 0% |
| Duncan | Cowichan Valley | 1.3% | 2.71% | 3.95% | 1.69% |
| Fort Nelson | Northern Rockies | 1.05% | 1.47% | 0.4% | 0.57% |
| Fernie | East Kootenay | 1.02% | 1.95% | 0.61% | 0% |
| Columbia-Shuswap Subdivision A[bt] | Columbia-Shuswap | 0.99% | 1.79% | 0% | 0% |
| Vernon | North Okanagan | 0.92% | 1.73% | 1.33% | 1.85% |
| Gold River | Comox-Strathcona | 0.87% | 1.55% | 0% | 0% |
| Montrose | Kootenay Boundary | 0.82% | 5.56% | 2.45% | 6.33% |
| Penticton | Okanagan-Similkameen | 0.81% | 1.53% | 1.36% | 2.84% |
| Logan Lake | Thompson-Nicola | 0.79% | 1.89% | 0.84% | 0% |
| Okanagan-Similkameen Subdivision B[bu] | Okanagan-Similkameen | 0.76% | 1.56% | 4.53% | 8.16% |
| Pemberton | Squamish-Lillooet | 0% | 1.37% | 0% | 0% |
| Canada | Total | 0.93% | 1.2% | 1.87% | 2.54% |
 South Asian Canadians formed up to 22% of the population in Fort St. James during the mid-to-late 20th century.
 South Asian Canadians formed up to 14% of the population in Quesnel during the mid-to-late 20th century.
 South Asian Canadians formed up to 13% of the population in Lake Cowichan during the mid-to-late 20th century.
 South Asian Canadians formed up to 13% of the population in Merritt during the mid-to-late 20th century.
 South Asian Canadians formed up to 12% of the population in Williams Lake during the mid-to-late 20th century.


 South Asian Canadians formed up to 10% of the population in Tahsis during the mid-to-late 20th century.
 South Asian Canadians formed up to 10% of the population in 100 Mile House during the mid-to-late 20th century.
 South Asian Canadians formed up to 9% of the population in Golden during the mid-to-late 20th century.
 South Asian Canadians formed up to 9% of the population in Squamish during the mid-to-late 20th century.
 South Asian Canadians formed up to 9% of the population in Lillooet during the mid-to-late 20th century.

.jpg)
.jpg)


Manitoba
- Thompson (9.3%)
- Winnipeg (8.5%)
- West St. Paul (7.6%)
Ontario

- Brampton (52.4%)
- Milton (28.2%)
- Ajax (26.2%)
- Mississauga (25.4%)
- Caledon (21.4%)
- Pickering (21.2%)
- Markham (17.6%)
- Toronto (14.0%)
- Whitchurch-Stouffville (13.8%)
- Oakville (13.5%)
- Whitby (12.0%)
- Cambridge (11.7%)
- Vaughan (11.2%)
- Waterloo (10.7%)
- Kitchener (9.9%)
- Oshawa (9.3%)
- Bradford West Gwillimbury (9.0%)
- Pickle Lake (8.9%)
- Mono (7.8%)
- Richmond Hill (7.6%)
- Guelph (7.4%)
- Shelburne (7.2%)
- Puslinch (7.1%)
- Windsor (7.1%)
Québec
- Dollard-des-Ormeaux (12.2%)
- Vaudreuil-Dorion (9.7%)
- Vaudreuil-sur-le-Lac (8.8%)
Saskatchewan
Immigration
For much of the early 20th century restrictions such as the continuous journey regulation and quotas were placed on people immigrating from the countries of South Asia to prevent them from immigrating to Canada. When these restrictions were removed in the 1960s immigration from the Indian subcontinent and other places like the African Great Lakes, the Caribbean and Fiji gradually increased. As of 2012, India was the third largest source of immigrants for Canada behind the Philippines and China respectively. Pakistan was the fourth, Sri Lanka the seventeenth, Bangladesh the nineteenth and Nepal the thirty-eighth. In addition immigrants to Canada arrive from regions such as the Arab States of the Persian Gulf, the Caribbean and the African Great Lakes (as well as European countries). Historically, British Columbia was the traditional destination for Punjabi immigrants. Beginning in the 1970s, however, Ontario grew to become the top destination due to its job availability. In recent years migration to Alberta has also increased due to its comparatively stronger economy and better job market.
| Year | India | Pakistan | Bangladesh | Sri Lanka | Nepal | Total |
|---|---|---|---|---|---|---|
| 1980 | 8 880 | 978 | 83 | 185 | 1 | 10 127 |
| 1981 | 8 670 | 972 | 84 | 371 | 1 | 10 098 |
| 1982 | 8 148 | 1 201 | 86 | 290 | 6 | 9 731 |
| 1983 | 7 338 | 900 | 81 | 197 | 1 | 8 517 |
| 1984 | 5 704 | 668 | 98 | 1 086 | 2 | 7 558 |
| 1985 | 4 211 | 514 | 92 | 845 | 4 | 5 666 |
| 1986 | 7 151 | 691 | 486 | 1 838 | 13 | 10 179 |
| 1987 | 10 189 | 1 072 | 503 | 4 447 | 6 | 16 217 |
| 1988 | 11 522 | 1 334 | 476 | 2 779 | 13 | 16 124 |
| 1989 | 10 343 | 2 261 | 387 | 2 758 | 4 | 15 753 |
| 1990 | 12 041 | 2 470 | 611 | 3 525 | 23 | 18 670 |
| 1991 | 13 733 | 3 079 | 1 115 | 7 266 | 29 | 25 222 |
| 1992 | 13 673 | 4 071 | 1 655 | 13 102 | 32 | 32 533 |
| 1993 | 21 496 | 4 777 | 1 280 | 9 563 | 40 | 37 156 |
| 1994 | 18 620 | 4 666 | 1 361 | 7 150 | 31 | 31 828 |
| 1995 | 18 488 | 4 994 | 2 042 | 9 368 | 66 | 34 958 |
| 1996 | 23 859 | 9 125 | 2 824 | 6 484 | 132 | 42 424 |
| 1997 | 22 268 | 13 073 | 3 378 | 5 415 | 155 | 44 289 |
| 1998 | 17 241 | 9 068 | 2 202 | 3 566 | 104 | 32 181 |
| 1999 | 18 974 | 9 979 | 2 064 | 4 982 | 157 | 36 156 |
| 2000 | 28 535 | 15 395 | 3 117 | 6 077 | 236 | 53 360 |
| 2001 | 31 204 | 16 705 | 3 832 | 5 860 | 272 | 57 873 |
| 2002 | 31 894 | 15 092 | 2 944 | 5 272 | 363 | 55 565 |
| 2003 | 27 135 | 13 204 | 2 138 | 4 886 | 312 | 47 675 |
| 2004 | 28 199 | 13 399 | 2 660 | 4 489 | 403 | 49 150 |
| 2005 | 36 179 | 14 314 | 4 171 | 4 918 | 607 | 60 189 |
| 2006 | 33 773 | 13 128 | 4 012 | 4 651 | 540 | 56 104 |
| 2007 | 28 731 | 10 123 | 2 897 | 4 097 | 511 | 46 359 |
| 2008 | 28 257 | 8 984 | 2 939 | 4 751 | 581 | 45 512 |
| 2009 | 29 452 | 7 215 | 2 106 | 4 543 | 561 | 43 877 |
| 2010 | 34 226 | 6 812 | 4 721 | 4 420 | 1 392 | 51 571 |
| 2011 | 27 488 | 7 467 | 2 694 | 3 310 | 1 129 | 42 088 |
| 2012 | 30 920 | 11 208 | 2 634 | 3 338 | 1 185 | 49 285 |
| 2013 | 33 078 | 12 611 | 3 792 | 2 394 | 1 308 | 53 183 |
| 2014 | 38 330 | 9 113 | 2 233 | 2 604 | 1 219 | 53 499 |
| 2015 | 39 340 | 11 295 | 3 305 | 1 785 | 1 525 | 57 250 |
| 2016 | 39 705 | 11 350 | 3 230 | 1 535 | 755 | 56 575 |
| 2017 | 51 590 | 7 655 | 3 190 | 2 150 | 1 110 | 65 695 |
| 2018 | 69 980 | 9 490 | 3 205 | 2 165 | 1 400 | 86 240 |
| 2019 | 85 585 | 10 790 | 3 395 | 2 235 | 1 410 | 103 415 |
| 2020 | 42 885 | 6 230 | 1 615 | 1 010 | 570 | 52 310 |
| Total | 1,059,035 | 307,473 | 85,738 | 161,707 | 18,209 | 1,632,162 |
See also
Notes
- "Later, in 1897, Queen Victoria’s Jubilee was held in London and Indian troops were sent there to participate in the celebration. Thereafter they were sent back to India via Canada. The idea was that the troops might see different parts of the Empire. The Indian soldiers were much impressed and told their colleagues and relations at home about the wealth, abundance and fertility of Canada as well as the opportunities it afforded to new settlers. Through the reports of soldiers stationed in the Far East who visited Canada and then settled there and later from soldiers returning from the Jubilee, Canada was introduced to the Indian population as a land of tempting opportunities."[22]: 33–34
- The four original provinces of Canada (Quebec, Ontario, Nova Scotia, and New Brunswick) were enumerated during the 1871 census. At this time, all South Asians were labeled as Hindu, regardless of their actual religion or ethnic origin
- "There were a good number of old Sikh soldiers in the Chinese towns of Canton, Shanghai, Hong Kong, and other places. Those were the people who stayed on there after taking part in the Boxer Rebellion campaign. A hard core among those men journeyed from there to North America, and so also the Punjabis who attended the Jubilee celebrations in London."[20]: 316
- "Hence the East Indians responded warmly when news of better economic opportunities in Canada reached them, indirectly, from the Chinese who had been sending glowing reports home from Canada and, directly from Sikh soldiers who, after participating in the Queen Victoria Jubilee Celebration in London, had passed through Canada."[21]: 17
- "Since the Canadian government was preoccupied with restricting Chinese and Japanese immigration at the time, South Asians were quite easily able to find employment. On average, these men earned from $1 to $1.25 a day, but this was less than the pay received by workers of European descent. Some socially conscious employers, however, did pay their South Asian workers up to $1.50 to $2.00 a day."[25]: 4–5
- "But the earliest Indian immigrants came not from India proper but from Indian communities already settled in Malaya, Hong Kong and Shanghai, where Indians were generally employed as night watchmen and police constables, a large number having previously been soldiers. These men were mostly of good appearance and strong physique, but they had little knowledge of English. In the new land they steadily found employment of a far more remunerative character than could be obtained in Hong Kong and China. Their success in Canada resulted in a slow in-flow of new immigrants from India."[22]: 34
- "According to the Canadian national census, 2,292 Indians (from India) resided in British Columbia in 1911, including just three women and scarcely any children. This was a population of mobile male workers, bachelors and married men, all living far from their families in Punjab. The count would have been much the same three years later in the summer of 1914, at the time of the Komagata Maru. But a year after that, a province-wide survey by immigration officials showed that at least half had gone. The main reason that the officials heard from the men they spoke to was "lack of work." In 1918, the BC Department of Labour reported only 567 Indians employed in industry in the province. Adding in the unemployed and self-employed, the total population of Indians then could not have been more than 700. The work shortage that drove so many men out of the province came from general cutbacks on the railways, in the mines, and in lumber mills."[28]: 191
- "When they arrived on British Columbia’s West coast in the early years between 1903 and 1906, for the most part they found their new home welcoming and inclusive of the rights afforded to them as British subjects in Canada. Until 1906 South Asian immigrants received almost no government or press notice and there were no immigration laws or regulations that impeded or affected their entry to Canada in these first years."[25]: 4
- "In this venture they were initially encouraged. Manual labour was scarce and wages were high in British Columbia, and a supply of able-bodied Indian labourers ready to work well for a moderate wage and giving no trouble in the matter of trade unions was distinctly useful to white employers."[22]: 35
- "However, the Chinese, Japanese and Europeans could still come to Canada on a through ticket purchased in their home country whereas the East Indian could not since there was no direct steamship route between Canada and India. The dominion government had succeeded in eliminating the problem without overtly naming the East Indians."[21]: 139–140
- "Gurdit Singh a successful railway labour contractor and rubber plantation owner in Malaysia, Maru charters the Komagata Maru and starts to sell tickets to Indians residing temporarily in Hong Kong who want to immigrate to Canada. The journey also included two women and four children in total although very little is known beyond the fact the one woman was the spouse of a resident doctor on board the ship. Bhagwan Singh Gyanee, a well-known Ghadarite also stepped aboard the ship while it was docked in Hong Kong to make a passionate anti-colonial speech."[25]: 10
- "In the pre-war period, British Columbians had vehemently objected to any suggestion that Indians should be allowed to bring in wives, because a community with women would be permanent. Without women, and without further immigration, it was predicted that the Indian community would gradually disappear. After World War 1, the Canadian government changed its position on the admission of wives and children in response to pressure from Britain, which argued that Canada's policy was damaging to the British position in India. After 1918, Indian men resident in Canada, were allowed to bring in wives and their children under eighteen. The door was also opened for students, tourists, and other non-immigrants. Yet only two women came in the first year and, on average, about 11 a year over the course of the next two decades."[35]: 10
- "Most of them, however, had not been able to break out of the lumber industry, although, within that industry, some had done well, so that, by the early 1920s, six sawmills and two shingle mills in British Columbia were owned and operated by Sikhs. Many Sikhs had gone into business as suppliers of fuel, bidding for waste wood and sawdust from sawmills and delivering to private residences."[35]: 11
- "The economic depression during the period between the two wars was responsible for restricting the number of migrants and also for the movements of those already settled in Canada to new positions where they employed themselves and were not dependent on company jobs. The result was that Indians went into trucking and farming, and some of them set up their own sawmills. But they became more isolated from the white community. Since they were mainly a male population and were not used to social activities as European Canadians were, the temple became their principal meeting place, both for worship and social exchanges. The temple was the centre of their community and the Society they formed there continued to be important in spite of the decrease in the number of Indians in the population."[22]: 405–406
- "When the period between the wars was marked by the internal economic troubles of the depression, Indians had to move from factories to other vocations which included trucking, fuel supplies and farming. By 1940 some Indians owned small businesses and this slight prosperity allowed them to send for their wives and children."[22]: 442
- "In March 1907, British Columbia Premier William Bowser introduced a bill to disenfranchise all natives of India not of Anglo-Saxon parents. In April 1907 South Asians were denied the vote in Vancouver by changes to the Municipality Incorporation Act. The federal vote was denied by default as one had to be on the provincial voter’s list to vote federally. South Asians would be barred from the political process in Canada for the next 40 years until 1947 when the vote was finally reinstated after much struggle."[25]: 5
- "Immigration regulations, however, did not change until 1951 when, in the interest of improved relations with the now independent Commonwealth countries of South Asia, Canada agreed to accept a token number of unsponsored immigrants, symbolically ending an era that had begun in 1908. Annual quotas of 150, 100, and 50 were established for India, Pakistan, and Sri Lanka over and above the sponsored immigration category, which was extended to include elderly parents as well as spouses and children under 21."[35]: 11
- "These international problems arising out of the American/Russian race for a sphere of influence in Asia may have hastened the formalisation of an agreement between Canada and India and Pakistan on the migration issue. In any case a formal agreement was signed in Ottawa between India and Canada on January 26, 1951 by which Canada offered to accept 150 Indian immigrants under the general category. A similar agreement was signed in Karachi with the Pakistan government by which 100 Pakistani immigrants were to be allowed into Canada annually."[22]: 421
- When Grewall was nominated as a candidate for the CCF party in the Dewdney riding in 1956, this drew excitement. But, according to Barrett, Grewall faced open discrimination on the campaign trail. "The former mayor knew the risk he was taking and many people were surprised he took this risk to enter the race," said Barrett. Barrett said Grewall overcame many racial insults along the way. "Every kid in the North Fraser, who thinks he or she is being discriminated against, should read the Grewall story and the challenges he faced." Grewall was later found dead in a Seattle motel room with a gunshot wound to the head in July of 1957. He was 47 years of age.[78]
- After losing his MLA bid in 1956 to SoCred Labor Minister Lyle Wicks, Grewal began receiving threats. Fires were set at his mills and his house was set ablaze. On July 17, 1957, while on a business trip, Grewall was found dead in a Seattle motel. He had been shot in the head. Although local police ruled it a suicide, Grewall's family believes he was a victim of foul play. Grewall was survived by his wife and three children, who left Mission City shortly after his death. Despite the suspicious circumstances of his death, Grewall's story is more notable for his legacy of community involvement than for his untimely demise.[75]
- "Canada's demand for trained immigrant workers seemed to be exceeding the expected supply, so by August 1965 the Canadian government launched an intensified programme to bring about a greater flow of professional skilled and trained immigrants into the country.[...]Therefore, the Minister proposed to step up the expansion of immigration services in various countries of Europe and even explored the possibilities of encouraging migration from South East Asian and Far Eastern countries."[22]: 429–430
- "The Sikh "community" of Vancouver lower mainland, where most B.C. Sikhs live, is not a residential entity; it operates more as a collection of reference groups of relatives, friends, and acquaintances who recognize a common ethnic membership, a proudly shared religion, mutual interests, and several temples."[27]: 22
- "Many arrivals in the province can be linked directly to the forced migration out of Uganda in 1972, but those coming from places like Tanzania, Kenya, Madagascar, Mozambique, and the Congo left for different reasons. Some feared that their governments might treat “Asian” minorities in similar ways and fled in anticipation, while others came as immigrants following a landmark change in Canadian law in the 1960s. Many who arrived during the 1950s and 60s tended not to be traders and merchants but were professionals like doctors and lawyers. By 1968, the number of Ismailis across Canada numbered less than a thousand, with the community existing in small groups scattered across major cities like Vancouver, Toronto, and Montréal."[25]: 109–110
- "In 1972 a new problem was created for Canadian immigration officials when Uganda expelled a large number of Asians. Canada accepted about 6,400 such expellees and the Canadian government chartered commercial aircraft to bring these refugees to the Canadian Forces base at Longue Points (Montreal)."[22]: 435
- "Although the Sikhs formed the largest religious group among the Indians in the initial phase of immigration, the later waves of migration has led to the sizeable presence of other religious groups within the Indian diaspora. One illustration of this change is evident in the 1981 Census, which revealed that Hindus outnumber Sikhs in the majority of the provinces in Canada except British Columbia. Indeed, not only Hindus but also other religious groups have slowly made their way in to the Canadian society. The first group of Hindus migrated to Canada during the 1960s from the province of Uttar Pradesh and the surrounding regions of northern India."[49]: 88–89
- "By the 1960s South Asian diaspora began coming from Uganda, Kenya, Guyana, Trinidad and Fiji — all areas that had been colonized and employed South Asian (often indentured) labour to build their railways and other colonial infrastructure. This labour then became the South Asian diaspora in these countries. Many who arrived in this period had worked in a variety of jobs and were arguably more skilled than earlier immigrants. Crucially, several spoke English, which was very useful in building links with the labour movement."[25]: 259–260
- "However, since 1967, immigrants from other parts of India and from Pakistan, Fiji, and Africa have also gained entry to Canada. Unlike the Sikhs, most of these people have come from urban settings, because, without relatives in Canada to sponsor them (at least in the first phase), they came as independent immigrants and needed to have advanced education or special job skills to quality for entry. Like other immigrants, they have headed for Canada's major metropolitan areas, which in the past 20 years, has meant Toronto ahead of Vancouver, although Vancouver well ahead of Montreal, Calgary, and Edmonton."[35]: 14
- "Many may know the macro stories of how soldiers from India served as one of the largest contingencies within the commonwealth and for the British Empire - but a lesser-known story, is the one of ten Canadian Sikh soldiers who served for Canada during a time when they were told they do not belong to the state, and are in fact, undesired and unwelcome. This chapter, in highlighting many contradictions of state sanctioned racism and denial is also a complicated space from the South Asian Canadian experience. For those Sikh soldiers in particular who decided to fight for Canada when Canada denied their people rights - it is a story and history worthy of sharing."[25]: 12
- Canadians of South Asian origin are almost equally divided among the Sikh, Hindu and Muslim faith groups. In 2001, 28% of South Asians reported they were Sikh, 28% said they were Hindu, and 22% were Muslim. At the same time, another 16% reported that they were Christian. In contrast, relatively few people of South Asian origin have no religious affiliation. In 2001, just 4% said they had no religious affiliation, compared with 17% of the overall population.[117]
- 2000 First South Asian Premier in BC Ujjal Dosanjh is elected as the 33rd Premier of British Columbia after serving as an MLA and Attorney General. Later he would serve as an MP and Minister of Health. (35)
- 2021 census: Statistic includes all persons with ethnic or cultural origin responses with ancestry to the nation of India, including "Anglo-Indian" (3,340), "Bengali" (26,675), "Goan" (9,700), "Gujarati" (36,970), "Indian" (1,347,715), "Jatt" (22,785), "Kashmiri" (6,165), "Maharashtrian" (4,125), "Malayali" (12,490), "Punjabi" (279,950), "Tamil" (102,170), and "Telugu" (6,670).[1][129]
- 2016 census: Statistic includes all persons with ethnic or cultural origin responses with ancestry to the nation of India, including "Bengali" (22,900), "Goan" (6,070), "Gujarati" (8,350), "East Indian" (1,374,715), "Kashmiri" (3,115), "Punjabi" (118,395), and "Tamil" (48,670).[71]
- 2011 census: Statistic includes all persons with ethnic or cultural origin responses with ancestry to the nation of India, including "Bengali" (17,960), "Goan" (5,125), "Gujarati" (5,890), "East Indian" (1,165,145), "Kashmiri" (2,125), "Punjabi" (76,150), and "Tamil" (48,965).[70]
- 2006 census: Statistic includes all persons with ethnic or cultural origin responses with ancestry to the nation of India, including "Bengali" (12,130), "Goan" (4,815), "Gujarati" (2,975), "East Indian" (962,670), "Kashmiri" (1,685), "Punjabi" (53,515), and "Tamil" (34,590).[69]
- 2001 census: Statistic includes all persons with ethnic or cultural origin responses with ancestry to the nation of India, including "Bengali" (7,020), "Goan" (3,865), "Gujarati" (2,805), "East Indian" (713,330), "Kashmiri" (480), "Punjabi" (47,155), and "Tamil" (39,075).[68]
- 1996 census: Statistic includes all persons with ethnic or cultural origin responses with ancestry to the nation of India, including "Bengali" (3,790), "Goan" (4,415), "Gujarati" (2,155), "East Indian" (548,080), "Punjabi" (49,840), and "Tamil" (30,065).[67]
- Including Zoroastrianism, Judaism, Indigenous spirituality others, or not stated
- The question on knowledge of languages allows for multiple responses.
- Part of United Kingdom
- Note: Subdivisions shown below have South Asian Canadian populations above the national average.
- Rural region including Clearwater, Vavenby, etc.