City of Doncaster Council elections
Local government elections in South Yorkshire, England
From Wikipedia, the free encyclopedia
The City of Doncaster Council is the local authority for Doncaster in South Yorkshire, England. The council is elected every four years. Since 2002 the council has been led by a directly elected mayor.
From 1973 to 2014, the council was elected by thirds every year except the year in which country council elections took place in other parts of England. In 2015, the whole council was elected due to boundary changes to the wards and it was decided that the whole council would be elected every four years in future from 2017, so that the council elections would coincide with the election of the Mayor of Doncaster in future.[1]
Council elections
- 1998 Doncaster Metropolitan Borough Council election
- 1999 Doncaster Metropolitan Borough Council election
- 2000 Doncaster Metropolitan Borough Council election
- 2002 Doncaster Metropolitan Borough Council election
- 2003 Doncaster Metropolitan Borough Council election
- 2004 Doncaster Metropolitan Borough Council election (whole council elected after boundary changes)[2]
- 2006 Doncaster Metropolitan Borough Council election
- 2007 Doncaster Metropolitan Borough Council election
- 2008 Doncaster Metropolitan Borough Council election
- 2010 Doncaster Metropolitan Borough Council election
- 2011 Doncaster Metropolitan Borough Council election
- 2012 Doncaster Metropolitan Borough Council election
- 2014 Doncaster Metropolitan Borough Council election
- 2015 Doncaster Metropolitan Borough Council election (boundary changes)
- 2017 Doncaster Metropolitan Borough Council election
- 2021 Doncaster Metropolitan Borough Council election
- 2025 City of Doncaster Council election
Results maps
 2004 results map
 2006 results map
 2007 results map
 2008 results map
 2010 results map
 2011 results map
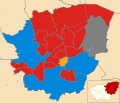 2012 results map
 2014 results map
 2015 results map
 2017 results map
 2021 results map
 2025 results map


By-election results
1994–1998
| Party | Candidate | Votes | % | ±% | |
|---|---|---|---|---|---|
| Liberal Democrats | 1,330 | 55.9 | +45.2 | ||
| Labour | 1,048 | 44.1 | −27.3 | ||
| Majority | 282 | 11.8 | |||
| Turnout | 2,378 | 19.7 | |||
| Liberal Democrats gain from Labour | Swing | ||||
1998–2002
| Party | Candidate | Votes | % | ±% | |
|---|---|---|---|---|---|
| Rossington Independent | 538 | 30.2 | +11.4 | ||
| Labour | 533 | 30.0 | +3.5 | ||
| Independent | 456 | 25.6 | −17.8 | ||
| Conservative | 129 | 7.3 | +0.1 | ||
| Independent | 80 | 4.5 | +4.5 | ||
| Liberal Democrats | 43 | 2.4 | +2.4 | ||
| Majority | 5 | 0.2 | |||
| Turnout | 1,779 | 18.0 | |||
| Independent gain from Labour | Swing | ||||
| Party | Candidate | Votes | % | ±% | |
|---|---|---|---|---|---|
| Labour | 1,071 | 51.6 | |||
| Liberal Democrats | 614 | 29.5 | |||
| Conservative | 390 | 18.7 | |||
| Majority | 457 | 22.1 | |||
| Turnout | 2,075 | 17.0 | |||
| Labour hold | Swing | ||||
| Party | Candidate | Votes | % | ±% | |
|---|---|---|---|---|---|
| Labour | 941 | 45.0 | |||
| Liberal Democrats | 859 | 41.1 | |||
| Conservative | 290 | 13.8 | |||
| Majority | 82 | 3.9 | |||
| Turnout | 2,090 | 24.5 | |||
| Labour hold | Swing | ||||
| Party | Candidate | Votes | % | ±% | |
|---|---|---|---|---|---|
| Labour | 742 | 38.1 | −19.6 | ||
| Liberal Democrats | 620 | 31.8 | −0.1 | ||
| Ratepayers against Landfill | 523 | 26.8 | +26.8 | ||
| Conservative | 122 | 3.3 | −7.1 | ||
| Majority | 122 | 6.3 | |||
| Turnout | 2,007 | ||||
| Labour hold | Swing | ||||
| Party | Candidate | Votes | % | ±% | |
|---|---|---|---|---|---|
| Labour | 938 | 53.5 | −9.1 | ||
| Independent Labour | 532 | 30.3 | +6.8 | ||
| Independent | 140 | 8.0 | +8.0 | ||
| Liberal Democrats | 76 | 4.3 | −3.0 | ||
| Conservative | 68 | 3.9 | −1.9 | ||
| Majority | 406 | 23.2 | |||
| Turnout | 1,754 | 16.1 | |||
| Labour hold | Swing | ||||
| Party | Candidate | Votes | % | ±% | |
|---|---|---|---|---|---|
| Labour | 763 | 53.2 | −5.0 | ||
| Liberal Democrats | 404 | 28.2 | +10.5 | ||
| Conservative | 266 | 18.6 | −5.6 | ||
| Majority | 359 | 25.0 | |||
| Turnout | 1,433 | 13.9 | |||
| Labour hold | Swing | ||||
2002–2006
| Party | Candidate | Votes | % | ±% | |
|---|---|---|---|---|---|
| Labour | Nora Troops | 1,170 | 56.7 | +8.1 | |
| Liberal Democrats | Kevin Abell | 444 | 21.5 | −1.5 | |
| Conservative | Kathleen Fletcher | 238 | 11.5 | +0.0 | |
| BNP | David Owen | 210 | 10.2 | −1.8 | |
| Majority | 726 | 35.2 | |||
| Turnout | 2,062 | 17.0 | |||
| Labour hold | Swing | ||||
| Party | Candidate | Votes | % | ±% | |
|---|---|---|---|---|---|
| Labour | Tony Corden | 940 | 49.7 | +9.0 | |
| Independent | 822 | 43.5 | −6.8 | ||
| Conservative | 95 | 5.0 | −4.0 | ||
| Independent | 33 | 1.7 | +1.7 | ||
| Majority | 118 | 6.2 | |||
| Turnout | 1,890 | 14.1 | |||
| Labour gain from Independent | Swing | ||||
| Party | Candidate | Votes | % | ±% | |
|---|---|---|---|---|---|
| Liberal Democrats | Susan Phillips | 2,670 | 56.8 | +6.6 | |
| Labour | 1,866 | 39.7 | −2.9 | ||
| Conservative | 163 | 3.5 | −0.3 | ||
| Majority | 804 | 17.1 | |||
| Turnout | 4,699 | 45.0 | |||
| Liberal Democrats hold | Swing | ||||
| Party | Candidate | Votes | % | ±% | |
|---|---|---|---|---|---|
| Labour | John McHale | 2,903 | 58.0 | +17.1 | |
| Liberal Democrats | Jonathan Snelling | 2,107 | 42.0 | +7.7 | |
| Majority | 796 | 16.0 | |||
| Turnout | 5,010 | 47.8 | |||
| Labour gain from Liberal Democrats | Swing | ||||
2006–2010
| Party | Candidate | Votes | % | ±% | |
|---|---|---|---|---|---|
| Labour | Richard Cooper-Holmes | 637 | 26.9 | +1.1 | |
| English Democrat | Mick Cooper | 551 | 23.3 | ||
| Independent | John Cooke | 506 | 21.4 | ||
| Independent | Terry Wilde | 420 | 17.7 | ||
| BNP | Dave Owen | 101 | 4.3 | +4.3 | |
| Liberal Democrats | Robert Mitchell | 78 | 3.3 | +3.3 | |
| Independent | George Sheldon | 76 | 3.2 | ||
| Majority | 86 | 3.6 | |||
| Turnout | 2,369 | 24.6 | |||
| Labour gain from Independent | Swing | ||||
2010–2015
| Party | Candidate | Votes | % | ±% | |
|---|---|---|---|---|---|
| Labour | Iris Beech | 1,165 | 54.0 | −16.4 | |
| Liberal Democrats | Adrian McLeay | 261 | 12.1 | +12.1 | |
| UKIP | Frank Calladine | 231 | 10.7 | +10.7 | |
| Conservative | Martin Greenhalgh | 225 | 10.4 | −19.2 | |
| Independent | Martyn Bev | 106 | 4.9 | +4.9 | |
| English Democrat | David Allen | 98 | 4.5 | +4.5 | |
| TUSC | Mary Jackson | 72 | 3.3 | +3.3 | |
| Majority | 904 | 41.9 | |||
| Turnout | 2,158 | ||||
| Labour hold | Swing | ||||
2015–2017
| Party | Candidate | Votes | % | ±% | |
|---|---|---|---|---|---|
| Labour | Andrea Robinson | 1,148 | 44.5 | +7.4 | |
| UKIP | Paul Bissett | 960 | 37.2 | +5.8 | |
| Conservative | Martin Greenhalgh | 268 | 10.4 | −8.1 | |
| Liberal Democrats | Stephen Porter | 202 | 7.8 | +7.8 | |
| Majority | 188 | 7.3 | |||
| Turnout | 2,578 | ||||
| Labour hold | Swing | ||||
2017–2021
| Party | Candidate | Votes | % | ±% | |
|---|---|---|---|---|---|
| Labour | Tosh McDonald | 1,084 | 46.8 | +7.7 | |
| Yorkshire | Chris Whitwood | 570 | 24.6 | −1.1 | |
| Green | Julie Buckley | 294 | 12.7 | −1.0 | |
| Conservative | Carol Greenhalgh | 260 | 11.2 | −10.4 | |
| Liberal Democrats | Ian Smith | 66 | 2.8 | +2.8 | |
| Independent | Gareth Pendry | 43 | 1.9 | +1.9 | |
| Majority | 514 | 22.2 | |||
| Turnout | 2,317 | ||||
| Labour hold | Swing | ||||
2021–2025
| Party | Candidate | Votes | % | ±% | |
|---|---|---|---|---|---|
| Labour | Yetunde Elebuibon | 827 | 46.0 | +6.1 | |
| Conservative | Michael Angus | 419 | 23.3 | −2.2 | |
| Yorkshire | Andy Budden | 356 | 19.8 | +1.9 | |
| Green | Jennifer Rozenfelds | 135 | 7.5 | −2.8 | |
| Liberal Democrats | Dean Southall | 60 | 3.3 | −3.1 | |
| Majority | 408 | 22.7 | |||
| Turnout | 1,797 | ||||
| Labour hold | Swing | ||||
| Party | Candidate | Votes | % | ±% | |
|---|---|---|---|---|---|
| Labour | Ken Guest | 1,467 | 56.7 | +10.8 | |
| Conservative | Carol Greenhalgh | 492 | 19.0 | −1.1 | |
| Independent | John Cooke | 461 | 17.8 | −8.5 | |
| Reform | Surjit Singh Duhre | 168 | 6.5 | +6.5 | |
| Majority | 975 | 37.7 | |||
| Turnout | 2,588 | ||||
| Labour hold | Swing | ||||
| Party | Candidate | Votes | % | ±% | |
|---|---|---|---|---|---|
| Labour | Rob Dennis | 2,770 | 49.8 | +6.5 | |
| Reform | Surjit Singh Duhre | 892 | 16.0 | +16.0 | |
| Green | Julie Buckley | 805 | 14.5 | −3.3 | |
| Conservative | Dene Flannigan | 723 | 13.0 | −6.4 | |
| Independent | Nikki McDonald | 373 | 6.7 | +6.7 | |
| Majority | 1,878 | 33.8 | |||
| Turnout | 5,563 | ||||
| Labour hold | Swing | ||||
2025–2029
| Party | Candidate | Votes | % | ±% | |
|---|---|---|---|---|---|
| Reform | Isaiah-John Reasbeck | 1,062 | 43.8 | ||
| Labour | Matthew Jones | 912 | 37.6 | ||
| Independent | Jane Nightingale | 169 | 7.0 | ||
| Conservative | Christine Lunney | 121 | 5.0 | ||
| Green | Venessa Aradia | 79 | 3.3 | ||
| Liberal Democrats | Giulia Savini | 39 | 1.6 | ||
| TUSC | Andy Hiles | 29 | 1.2 | ||
| Workers Party | Ahsan Jamil | 15 | 0.6 | ||
| Majority | 150 | 6.2 | |||
| Turnout | 2,426 | ||||
| Reform hold | Swing | ||||