North Slave Region
Administrative region in Northwest Territories, Canada
From Wikipedia, the free encyclopedia
The North Slave Region or Tłicho Region is one of five administrative regions in the Northwest Territories of Canada. It is the most populous of the five regions, with a population of almost 23,000. According to Municipal and Community Affairs, the region consists of eight communities; the regional office is located in Yellowknife and a sub-office is in Behchokǫ̀.[1] With the exception of Yellowknife, the communities are predominantly First Nations.

CountryCanada
Regional offices[1]Yellowknife
Behchokǫ̀ (sub-office)
Behchokǫ̀ (sub-office)
North Slave Region | |
|---|---|
| |
 Location within the Northwest Territories | |
| Country | Canada |
| Territory | Northwest Territories |
| Federal riding | Northwest Territories |
| Territorial ridings | Monfwi Tu Nedhé-Wiilideh |
| Regional offices[1] | Yellowknife Behchokǫ̀ (sub-office) |
| Population (2021)[2] | |
• Total | 23,515 |
| • Rank | 1st NWT |
| • % change (from 2016) | 2.86 |
| Time zone | UTC−07:00 (MST) |
| • Summer (DST) | UTC−06:00 (MDT) |
| Highways | |

Communities
The North Slave Region includes the following communities:
| Community | Demographics (2021) | ||||||||
|---|---|---|---|---|---|---|---|---|---|
| Name[3] | Governance | Census[2] | Indigenous population profile[4] | ||||||
| Official | Traditional | Type[5] | Municipality[6] | Total | Change (from 2016) |
First Nations | Métis | Inuit | Other |
| Behchokǫ̀ | Tłı̨chǫ community government | Yes | 1,746 | -6.8% | 1,605 | 50 | 10 | 230 | |
| Dettah | T'èɂehda | Designated authority | No | 192 | -12.3% | 170 | 10 | 10 | 15 |
| Gamèti | Tłı̨chǫ community government | Yes | 252 | -9.4% | 240 | 0 | 0 | 15 | |
| Łutselk'e | Designated authority | No | 333 | 9.8% | 175 | 115 | 0 | 155 | |
| Ndilǫ | Yellowknives community | No | Included in Yellowknife | ||||||
| Wekweètì | Tłı̨chǫ community government | Yes | 109 | -15.5% | 100 | 10 | 0 | 10 | |
| Whatì | Tłı̨chǫ community government | Yes | 543 | 15.5% | 510 | 0 | 0 | 50 | |
| Yellowknife | Sǫ̀mbak'è | City | Yes | 20,340 | 3.9% | 3,325 | 865 | 765[a] | 16,980 |
Historical population | ||||||||||||||||||||||||||||||||||||||||||||||||||||||||||
|
| |||||||||||||||||||||||||||||||||||||||||||||||||||||||||
| Sources: NWT Bureau of Statistics (2001 - 2017)[7] | ||||||||||||||||||||||||||||||||||||||||||||||||||||||||||
Communities of the North Slave Region
Communities of the North Slave Region
 Gas station at Behchokǫ̀ (2009)
 Dettah government building ((2011)
 Łutselk'e ((2006)
 Ndilǫ street (2011)
 Wekweètì (2006)
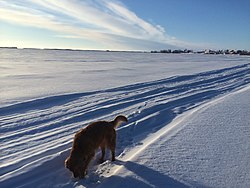 Trail near Whatì (2014)
 Looking towards downtown Yellowknife (2018)


.jpg)
Climate
| Climate data for Gamèti (Rae Lakes) Climate ID: 2203359; coordinates 64°06′43″N 117°19′41″W; elevation: 223.2 m (732 ft); 1981-2010 normals | |||||||||||||
|---|---|---|---|---|---|---|---|---|---|---|---|---|---|
| Month | Jan | Feb | Mar | Apr | May | Jun | Jul | Aug | Sep | Oct | Nov | Dec | Year |
| Record high humidex | −1.1 | −1.8 | 8.1 | 19.1 | 26.7 | 33.9 | 36.4 | 31.9 | 26.2 | 17.8 | 3.3 | 1.4 | 36.4 |
| Record high °C (°F) | −0.8 (30.6) |
−1.4 (29.5) |
9.4 (48.9) |
19.2 (66.6) |
26.7 (80.1) |
32.6 (90.7) |
32.0 (89.6) |
31.7 (89.1) |
23.6 (74.5) |
18.3 (64.9) |
5.0 (41.0) |
1.7 (35.1) |
32.6 (90.7) |
| Mean daily maximum °C (°F) | −22.7 (−8.9) |
−18.3 (−0.9) |
−11.4 (11.5) |
1.3 (34.3) |
8.9 (48.0) |
17.9 (64.2) |
21.5 (70.7) |
17.1 (62.8) |
10.1 (50.2) |
−0.2 (31.6) |
−11.0 (12.2) |
−17.1 (1.2) |
−0.3 (31.5) |
| Daily mean °C (°F) | −27.1 (−16.8) |
−23.6 (−10.5) |
−18.5 (−1.3) |
−5.9 (21.4) |
3.4 (38.1) |
12.9 (55.2) |
16.8 (62.2) |
13.2 (55.8) |
7.0 (44.6) |
−2.7 (27.1) |
−14.5 (5.9) |
−21.5 (−6.7) |
−5.0 (23.0) |
| Mean daily minimum °C (°F) | −31.5 (−24.7) |
−28.9 (−20.0) |
−25.4 (−13.7) |
−13.1 (8.4) |
−2.2 (28.0) |
7.9 (46.2) |
12.2 (54.0) |
9.2 (48.6) |
3.8 (38.8) |
−5.2 (22.6) |
−18.1 (−0.6) |
−25.9 (−14.6) |
−9.8 (14.4) |
| Record low °C (°F) | −51.5 (−60.7) |
−47.8 (−54.0) |
−46.6 (−51.9) |
−35.5 (−31.9) |
−22.3 (−8.1) |
−1.0 (30.2) |
−0.1 (31.8) |
−1.0 (30.2) |
−7.7 (18.1) |
−28.1 (−18.6) |
−41.3 (−42.3) |
−47.1 (−52.8) |
−51.5 (−60.7) |
| Record low wind chill | −53.6 | −60.4 | −51.5 | −43.3 | −30.7 | −6.1 | 0.0 | 0.0 | −13.4 | −33.3 | −45.4 | −53.0 | −60.4 |
| Average relative humidity (%) (at 1500 LST) | 73.2 | 72.3 | 60.5 | 54.0 | 50.4 | 45.7 | 49.6 | 59.8 | 69.6 | 79.5 | 84.3 | 80.9 | 65.0 |
| Source: Environment and Climate Change Canada[8] | |||||||||||||
| Climate data for Yellowknife (Yellowknife Airport) WMO ID: 71936; coordinates 62°27′46″N 114°26′25″W; elevation: 205.7 m (675 ft); 1991–2020 normals, extremes 1942–present | |||||||||||||
|---|---|---|---|---|---|---|---|---|---|---|---|---|---|
| Month | Jan | Feb | Mar | Apr | May | Jun | Jul | Aug | Sep | Oct | Nov | Dec | Year |
| Record high humidex | 2.9 | 6.1 | 8.9 | 20.2 | 25.7 | 34.0 | 35.4 | 34.3 | 27.2 | 18.1 | 6.3 | 1.6 | 35.4 |
| Record high °C (°F) | 3.4 (38.1) |
6.2 (43.2) |
9.3 (48.7) |
20.4 (68.7) |
26.3 (79.3) |
31.1 (88.0) |
32.5 (90.5) |
32.6 (90.7) |
26.1 (79.0) |
19.0 (66.2) |
7.8 (46.0) |
2.8 (37.0) |
32.6 (90.7) |
| Mean maximum °C (°F) | −7.3 (18.9) |
−5.8 (21.6) |
2.8 (37.0) |
11.7 (53.1) |
21.2 (70.2) |
26.8 (80.2) |
27.9 (82.2) |
26.4 (79.5) |
19.4 (66.9) |
9.6 (49.3) |
0.7 (33.3) |
−4.8 (23.4) |
29.0 (84.2) |
| Mean daily maximum °C (°F) | −21.6 (−6.9) |
−18.0 (−0.4) |
−10.6 (12.9) |
0.3 (32.5) |
10.4 (50.7) |
18.6 (65.5) |
21.5 (70.7) |
18.4 (65.1) |
10.9 (51.6) |
1.5 (34.7) |
−9.0 (15.8) |
−18.0 (−0.4) |
0.4 (32.7) |
| Daily mean °C (°F) | −25.5 (−13.9) |
−22.7 (−8.9) |
−16.6 (2.1) |
−5.5 (22.1) |
5.3 (41.5) |
13.8 (56.8) |
17.1 (62.8) |
14.5 (58.1) |
7.6 (45.7) |
−1.0 (30.2) |
−12.6 (9.3) |
−21.8 (−7.2) |
−4.0 (24.8) |
| Mean daily minimum °C (°F) | −29.4 (−20.9) |
−27.4 (−17.3) |
−22.5 (−8.5) |
−11.3 (11.7) |
0.1 (32.2) |
9.0 (48.2) |
12.6 (54.7) |
10.5 (50.9) |
4.2 (39.6) |
−3.6 (25.5) |
−16.2 (2.8) |
−25.6 (−14.1) |
−8.3 (17.1) |
| Mean minimum °C (°F) | −41.0 (−41.8) |
−39.1 (−38.4) |
−36.8 (−34.2) |
−26.0 (−14.8) |
−9.4 (15.1) |
2.1 (35.8) |
7.4 (45.3) |
4.1 (39.4) |
−2.3 (27.9) |
−14.1 (6.6) |
−29.6 (−21.3) |
−38.4 (−37.1) |
−42.2 (−44.0) |
| Record low °C (°F) | −51.2 (−60.2) |
−51.2 (−60.2) |
−43.3 (−45.9) |
−40.6 (−41.1) |
−22.8 (−9.0) |
−4.4 (24.1) |
0.6 (33.1) |
−0.6 (30.9) |
−9.7 (14.5) |
−28.9 (−20.0) |
−44.4 (−47.9) |
−48.3 (−54.9) |
−51.2 (−60.2) |
| Record low wind chill | −64.0 | −61.0 | −56.8 | −53.2 | −31.8 | −11.2 | 0.0 | −4.8 | −16.4 | −36.3 | −54.7 | −58.9 | −64.0 |
| Average precipitation mm (inches) | 15.0 (0.59) |
11.0 (0.43) |
14.1 (0.56) |
11.6 (0.46) |
16.3 (0.64) |
28.9 (1.14) |
40.4 (1.59) |
44.0 (1.73) |
43.0 (1.69) |
28.8 (1.13) |
25.8 (1.02) |
15.1 (0.59) |
293.9 (11.57) |
| Average rainfall mm (inches) | 0.0 (0.0) |
0.0 (0.0) |
0.2 (0.01) |
2.9 (0.11) |
12.2 (0.48) |
28.0 (1.10) |
40.4 (1.59) |
44.0 (1.73) |
39.9 (1.57) |
12.0 (0.47) |
0.5 (0.02) |
0.0 (0.0) |
180.2 (7.09) |
| Average snowfall cm (inches) | 21.7 (8.5) |
16.1 (6.3) |
19.2 (7.6) |
9.9 (3.9) |
4.5 (1.8) |
0.0 (0.0) |
0.0 (0.0) |
0.0 (0.0) |
3.0 (1.2) |
20.1 (7.9) |
36.9 (14.5) |
23.7 (9.3) |
155.0 (61.0) |
| Average precipitation days (≥ 0.2 mm) | 11.1 | 9.3 | 8.6 | 4.8 | 5.7 | 7.0 | 9.5 | 11.2 | 12.2 | 13.7 | 14.6 | 11.5 | 119.1 |
| Average rainy days (≥ 0.2 mm) | 0.09 | 0.04 | 0.25 | 1.2 | 4.4 | 6.8 | 9.5 | 11.2 | 11.6 | 5.8 | 0.82 | 0.13 | 51.9 |
| Average snowy days (≥ 0.2 cm) | 12.4 | 10.3 | 9.5 | 4.1 | 1.9 | 0.04 | 0.0 | 0.0 | 1.2 | 9.6 | 16.0 | 13.2 | 78.2 |
| Average relative humidity (%) (at 15:00 LST) | 68.5 | 64.6 | 56.4 | 52.8 | 46.0 | 45.3 | 49.0 | 57.1 | 64.7 | 75.9 | 80.7 | 73.0 | 61.2 |
| Average dew point °C (°F) | −28.9 (−20.0) |
−26.6 (−15.9) |
−21.6 (−6.9) |
−11.6 (11.1) |
−3.1 (26.4) |
4.6 (40.3) |
8.8 (47.8) |
8.4 (47.1) |
3.4 (38.1) |
−3.7 (25.3) |
−14.8 (5.4) |
−25.0 (−13.0) |
−9.1 (15.6) |
| Mean monthly sunshine hours | 50.6 | 107.3 | 188.4 | 276.4 | 335.7 | 373.8 | 358.0 | 276.2 | 157.7 | 65.0 | 42.7 | 24.6 | 2,256.5 |
| Percentage possible sunshine | 26.8 | 43.5 | 51.8 | 62.2 | 60.8 | 63.0 | 61.2 | 55.5 | 40.3 | 21.0 | 20.2 | 15.4 | 43.5 |
| Average ultraviolet index | 0 | 0 | 1 | 2 | 4 | 5 | 5 | 4 | 2 | 1 | 0 | 0 | 2 |
| Source 1: Environment and Climate Change Canada[9] (sun 1981–2010[10]) (August maximum[11]) | |||||||||||||
| Source 2: Weather Atlas[12] (dew point, mean maximum, and mean minimum[13]) | |||||||||||||
| Climate data for Whatì WMO ID: 71163; Climate ID: 2202678; coordinates 63°08′01″N 117°14′41″W; elevation: 271.3 m (890 ft); 1991–2020 normals, extremes 1974–present | |||||||||||||
|---|---|---|---|---|---|---|---|---|---|---|---|---|---|
| Month | Jan | Feb | Mar | Apr | May | Jun | Jul | Aug | Sep | Oct | Nov | Dec | Year |
| Record high humidex | 3.9 | 6.5 | 12.7 | 17.1 | 29.1 | 37.7 | 36.8 | 35.2 | 32.3 | 17.8 | 5.4 | 6.1 | 37.7 |
| Record high °C (°F) | 4.1 (39.4) |
7.0 (44.6) |
13.1 (55.6) |
19.6 (67.3) |
29.1 (84.4) |
33.6 (92.5) |
33.7 (92.7) |
34.4 (93.9) |
30.9 (87.6) |
18.0 (64.4) |
5.6 (42.1) |
6.3 (43.3) |
34.4 (93.9) |
| Mean daily maximum °C (°F) | −20.6 (−5.1) |
−16.9 (1.6) |
−10.3 (13.5) |
1.3 (34.3) |
11.7 (53.1) |
19.5 (67.1) |
22.4 (72.3) |
18.8 (65.8) |
11.8 (53.2) |
0.8 (33.4) |
−10.2 (13.6) |
−18.1 (−0.6) |
0.9 (33.6) |
| Daily mean °C (°F) | −25.1 (−13.2) |
−22.6 (−8.7) |
−17.6 (0.3) |
−6.0 (21.2) |
5.6 (42.1) |
13.5 (56.3) |
16.4 (61.5) |
13.1 (55.6) |
6.9 (44.4) |
−2.5 (27.5) |
−14.4 (6.1) |
−22.5 (−8.5) |
−4.6 (23.7) |
| Mean daily minimum °C (°F) | −29.4 (−20.9) |
−28.2 (−18.8) |
−24.9 (−12.8) |
−13.4 (7.9) |
−0.5 (31.1) |
7.4 (45.3) |
10.4 (50.7) |
7.4 (45.3) |
1.9 (35.4) |
−5.7 (21.7) |
−18.6 (−1.5) |
−26.9 (−16.4) |
−10.0 (14.0) |
| Record low °C (°F) | −48.4 (−55.1) |
−47.4 (−53.3) |
−46.3 (−51.3) |
−41.6 (−42.9) |
−24.4 (−11.9) |
−5.1 (22.8) |
−2.0 (28.4) |
−3.3 (26.1) |
−9.5 (14.9) |
−32.4 (−26.3) |
−39.8 (−39.6) |
−46.1 (−51.0) |
−48.4 (−55.1) |
| Record low wind chill | −57.2 | −54.8 | −55.1 | −49.5 | −28.2 | −13.2 | −3.1 | −6.8 | −17.0 | −36.7 | −45.2 | −53.0 | −57.2 |
| Average relative humidity (%) (at 1500 LST) | 77.8 | 73.3 | 59.3 | 49.5 | 46.6 | 46.7 | 48.7 | 57.0 | 63.7 | 80.7 | 85.8 | 81.0 | 64.2 |
| Source: Environment and Climate Change Canada[14] | |||||||||||||
Notes
- 195 Inuvialuit