Ashfield District Council elections
Local government elections in Nottinghamshire, England
From Wikipedia, the free encyclopedia
Ashfield District Council elections are held every four years. Ashfield District Council is the local authority for the non-metropolitan district of Ashfield in Nottinghamshire, England. Since the last boundary changes in 2015, 35 councillors are elected from 23 wards.[1]
Council elections
- 1973 Ashfield District Council election
- 1976 Ashfield District Council election (New ward boundaries)[2]
- 1979 Ashfield District Council election
- 1983 Ashfield District Council election
- 1987 Ashfield District Council election
- 1991 Ashfield District Council election (District boundary changes took place but the number of seats remained the same)[3]
- 1995 Ashfield District Council election (District boundary changes took place but the number of seats remained the same)[4]
- 1999 Ashfield District Council election
- 2003 Ashfield District Council election (New ward boundaries)[5][6]
- 2007 Ashfield District Council election
- 2011 Ashfield District Council election
- 2015 Ashfield District Council election (New ward boundaries)[1]
- 2019 Ashfield District Council election
- 2023 Ashfield District Council election
District result maps
 2003 results map
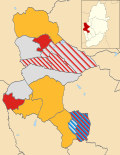 2007 results map
 2011 results map
 2015 results map
 2019 results map
 2023 results map


By-election results
1999–2003
| Party | Candidate | Votes | % | ±% | |
|---|---|---|---|---|---|
| Labour | 445 | 31.8 | −7.9 | ||
| Conservative | 420 | 30.0 | +30.0 | ||
| Independent Labour | 211 | 15.1 | +15.1 | ||
| Liberal Democrats | 205 | 14.7 | +14.7 | ||
| Independent | 118 | 8.4 | −23.1 | ||
| Majority | 25 | 1.8 | |||
| Turnout | 1,399 | 28.1 | |||
| Labour hold | Swing | ||||
| Party | Candidate | Votes | % | ±% | |
|---|---|---|---|---|---|
| Labour | Stephen Mays | 533 | 39.6 | ||
| Conservative | Eugene Di Villa | 438 | 32.5 | ||
| Liberal Democrats | Philip Birkitt | 375 | 27.9 | ||
| Majority | 95 | 7.1 | |||
| Turnout | 1,346 | ||||
| Labour hold | Swing | ||||
| Party | Candidate | Votes | % | ±% | |
|---|---|---|---|---|---|
| Labour | Christopher Davidson | 323 | 35.0 | −15.3 | |
| Independent | 249 | 27.0 | +27.0 | ||
| Independent | 181 | 19.6 | +19.6 | ||
| Conservative | 169 | 18.3 | −31.4 | ||
| Majority | 74 | 8.0 | |||
| Turnout | 922 | 15.9 | |||
| Labour gain from Conservative | Swing | ||||
2003–2007
| Party | Candidate | Votes | % | ±% | |
|---|---|---|---|---|---|
| Liberal Democrats | Austin Rathe | 848 | 40.7 | +40.7 | |
| Labour | Ian Briggs | 514 | 24.7 | −18.6 | |
| Independent | Ruth Welton | 389 | 18.7 | +18.7 | |
| BNP | Michael Clarke | 331 | 15.9 | −2.9 | |
| Majority | 334 | 16.0 | |||
| Turnout | 2,082 | ||||
| Liberal Democrats gain from Conservative | Swing | ||||
2007–2011
| Party | Candidate | Votes | % | ±% | |
|---|---|---|---|---|---|
| Liberal Democrats | Fiona Asbury | 873 | 37.0 | +37.0 | |
| Labour | Kier Barsby | 560 | 23.7 | −3.7 | |
| BNP | Michael Clarke | 321 | 13.6 | +13.6 | |
| Independent | John Ross | 275 | 11.7 | −38.2 | |
| Conservative | Michael Halls | 257 | 10.9 | −11.8 | |
| Green | Mark Harrison | 72 | 3.1 | +3.1 | |
| Majority | 313 | 13.3 | |||
| Turnout | 2,358 | 26.5 | |||
| Liberal Democrats gain from Independent | Swing | ||||
| Party | Candidate | Votes | % | ±% | |
|---|---|---|---|---|---|
| Liberal Democrats | Margaret Patrick | 996 | 33.8 | −31.9 | |
| Labour | Scott Darrington | 612 | 20.8 | +4.0 | |
| Conservative | Michael Halls | 519 | 17.6 | +7.3 | |
| BNP | Michael Clarke | 380 | 12.9 | +12.9 | |
| Independent | Alfred Thorpe | 299 | 10.2 | +2.9 | |
| Green | Mark Harrison | 140 | 4.8 | +4.8 | |
| Majority | 384 | 13.0 | |||
| Turnout | 2,946 | ||||
| Liberal Democrats hold | Swing | ||||
| Party | Candidate | Votes | % | ±% | |
|---|---|---|---|---|---|
| Liberal Democrats | Kevin Moore | 463 | 32.3 | +18.8 | |
| Labour | Trevor Charles | 392 | 27.3 | +6.8 | |
| Conservative | Robert Copley | 320 | 22.3 | −7.7 | |
| UKIP | Ronald Nixon | 181 | 12.6 | +12.6 | |
| Independent | Diane Butler | 79 | 5.5 | −30.5 | |
| Majority | 71 | 6.0 | |||
| Turnout | 1,435 | 26.2 | |||
| Liberal Democrats gain from Independent | Swing | ||||
| Party | Candidate | Votes | % | ±% | |
|---|---|---|---|---|---|
| Labour | Trevor Locke | 675 | 38.4 | +17.9 | |
| Conservative | Mick Murphy | 437 | 24.9 | −5.1 | |
| Liberal Democrats | Kenneth Cotham | 357 | 20.3 | +6.8 | |
| UKIP | Ronald Nixon | 158 | 9.0 | +9.0 | |
| BNP | Edward Holmes | 131 | 7.5 | +7.5 | |
| Majority | 238 | 13.5 | |||
| Turnout | 1,758 | 32.3 | |||
| Labour gain from Conservative | Swing | ||||
2011–2015
| Party | Candidate | Votes | % | ±% | |
|---|---|---|---|---|---|
| Labour | Jim Aspinall | 1,250 | 56.6 | +3.8 | |
| Independent | Tony Wallis | 458 | 20.7 | +20.7 | |
| Conservative | Shaun Hartley | 317 | 14.4 | +14.4 | |
| Liberal Democrats | Anthony Brewer | 184 | 8.3 | −19.4 | |
| Majority | 792 | 35.9 | |||
| Turnout | 2,209 | ||||
| Labour hold | Swing | ||||
2015–2019
| Party | Candidate | Votes | % | ±% | |
|---|---|---|---|---|---|
| Selston Parish Independents | Christine Quinn-Wilcox | 1,180 | 66.5 | +21.8 | |
| Independent | Anna Wilson | 294 | 16.6 | +16.6 | |
| Labour | Donna Gilbert | 172 | 9.7 | −4.3 | |
| UKIP | Ray Young | 77 | 4.3 | +4.3 | |
| Conservative | Michelle Sims | 52 | 2.9 | +2.9 | |
| Majority | 886 | 49.9 | |||
| Turnout | 1,775 | ||||
| Selston Parish Independents hold | Swing | ||||
| Party | Candidate | Votes | % | ±% | |
|---|---|---|---|---|---|
| Ashfield Ind. | John Wilmott | 1,329 | 51 | N/A | |
| Labour | Ian Morrison | 629 | 24 | N/A | |
| Conservative | Sheila Clarke | 532 | 20 | N/A | |
| UKIP | Stephen Crosby | 66 | 3 | N/A | |
| Liberal Democrats | James Harvey | 46 | 2 | N/A | |
| Ashfield Ind. gain from Conservative | Swing | ||||
| Party | Candidate | Votes | % | ±% | |
|---|---|---|---|---|---|
| Ashfield Ind. | Matthew Relf | 856 | 82 | N/A | |
| Labour | Kevin Ball | 97 | 9 | N/A | |
| Conservative | Christine Self | 48 | 4.6 | N/A | |
| Democrats and Veterans | Stephen Crosby | 26 | 2.4 | N/A | |
| UKIP | Moira Samson | 13 | 1.2 | N/A | |
| Liberal Democrats | Martin Howes | 5 | 0.4 | N/A | |
| Ashfield Ind. gain from Labour | Swing | ||||
2019–2023
| Party | Candidate | Votes | % | ±% | |
|---|---|---|---|---|---|
| Ashfield Ind. | Jamie Bell | 1,630 | 74.9 | +2.1 | |
| Labour | Perry Woodhouse | 547 | 25.1 | +9.3 | |
| Majority | 1,083 | 49.8 | |||
| Turnout | 2,177 | ||||
| Ashfield Ind. hold | Swing | ||||
| Party | Candidate | Votes | % | ±% | |
|---|---|---|---|---|---|
| Ashfield Ind. | Will Bostock | 1,137 | 60.7 | −20.3 | |
| Conservative | Sam Howlett | 426 | 22.7 | +18.1 | |
| Labour | Joanne Booker-Varley | 310 | 16.6 | +2.2 | |
| Majority | 711 | 38.0 | |||
| Turnout | 1,873 | ||||
| Ashfield Ind. hold | Swing | ||||
| Party | Candidate | Votes | % | ±% | |
|---|---|---|---|---|---|
| Ashfield Ind. | Nick Parvin | 710 | 54.5 | +17.9 | |
| Labour | John Wilkinson | 397 | 30.5 | +0.8 | |
| Conservative | Jan Lees | 195 | 15.0 | −3.9 | |
| Majority | 313 | 24.0 | |||
| Turnout | 1,302 | ||||
| Ashfield Ind. hold | Swing | ||||