Bernstein im Burgenland
Municipality in Burgenland, Austria
From Wikipedia, the free encyclopedia
Bernstein (Hungarian: Borostyánkő) is a municipality in Burgenland in the district Oberwart in Austria.
_-_Luftaufnahme.JPG)
Bernstein | |
|---|---|
Aerial view of Bernstein | |
 Coat of arms | |
 Location within Oberwart district | |
  Bernstein Location within Austria | |
| Coordinates: 47°24′N 16°15′E | |
| Country |  Austria Austria |
| State | Burgenland |
| District | Oberwart |
| Government | |
| • Mayor | Renate Habetler (SPÖ) |
| Area | |
• Total | 38.99 km2 (15.05 sq mi) |
| Population (2018-01-01)[2] | |
• Total | 2,123 |
| • Density | 54.45/km2 (141.0/sq mi) |
| Time zone | UTC+1 (CET) |
| • Summer (DST) | UTC+2 (CEST) |
| Postal code | 7434 |
| Website | https://www.bernstein.gv.at/ |
Geography
Parts of the municipality are Dreihütten, Redlschlag, Rettenbach, and Stuben.
Population
| Year | Pop. | ±% |
|---|---|---|
| 1869 | 2,896 | — |
| 1880 | 2,954 | +2.0% |
| 1890 | 2,921 | −1.1% |
| 1900 | 3,015 | +3.2% |
| 1910 | 2,909 | −3.5% |
| 1923 | 2,633 | −9.5% |
| 1934 | 2,690 | +2.2% |
| 1939 | 2,606 | −3.1% |
| 1951 | 2,465 | −5.4% |
| 1961 | 2,435 | −1.2% |
| 1971 | 2,470 | +1.4% |
| 1981 | 2,592 | +4.9% |
| 1991 | 2,493 | −3.8% |
| 2001 | 2,441 | −2.1% |
| 2011 | 2,267 | −7.1% |
Politics
Of the 23 positions on the municipal council, the SPÖ has 14, and the ÖVP 9.
Climate
| Climate data for Bernstein im Burgenland (1981–2010) | |||||||||||||
|---|---|---|---|---|---|---|---|---|---|---|---|---|---|
| Month | Jan | Feb | Mar | Apr | May | Jun | Jul | Aug | Sep | Oct | Nov | Dec | Year |
| Record high °C (°F) | 16.0 (60.8) |
19.2 (66.6) |
22.5 (72.5) |
25.3 (77.5) |
29.7 (85.5) |
34.0 (93.2) |
34.6 (94.3) |
35.2 (95.4) |
30.0 (86.0) |
23.9 (75.0) |
20.9 (69.6) |
17.0 (62.6) |
35.2 (95.4) |
| Mean daily maximum °C (°F) | 2.0 (35.6) |
4.0 (39.2) |
8.2 (46.8) |
13.6 (56.5) |
18.6 (65.5) |
21.4 (70.5) |
23.8 (74.8) |
23.3 (73.9) |
18.5 (65.3) |
13.1 (55.6) |
6.6 (43.9) |
2.5 (36.5) |
13.0 (55.4) |
| Daily mean °C (°F) | −2.0 (28.4) |
−0.8 (30.6) |
3.2 (37.8) |
8.1 (46.6) |
13.3 (55.9) |
16.0 (60.8) |
18.3 (64.9) |
17.9 (64.2) |
13.5 (56.3) |
8.8 (47.8) |
3.2 (37.8) |
−0.9 (30.4) |
8.2 (46.8) |
| Mean daily minimum °C (°F) | −3.8 (25.2) |
−2.7 (27.1) |
0.7 (33.3) |
5.0 (41.0) |
9.7 (49.5) |
12.6 (54.7) |
14.8 (58.6) |
14.7 (58.5) |
10.8 (51.4) |
6.3 (43.3) |
1.1 (34.0) |
−2.8 (27.0) |
5.5 (41.9) |
| Record low °C (°F) | −19.0 (−2.2) |
−19.9 (−3.8) |
−15.0 (5.0) |
−6.5 (20.3) |
0.0 (32.0) |
2.7 (36.9) |
6.0 (42.8) |
4.7 (40.5) |
2.5 (36.5) |
−6.0 (21.2) |
−11.8 (10.8) |
−16.7 (1.9) |
−19.9 (−3.8) |
| Average snowfall cm (inches) | 16 (6.3) |
20 (7.9) |
20 (7.9) |
6 (2.4) |
0 (0) |
0 (0) |
0 (0) |
0 (0) |
0 (0) |
1 (0.4) |
13 (5.1) |
21 (8.3) |
96 (38) |
| Average relative humidity (%) (at 14:00) | 71.1 | 61.8 | 57.9 | 52.7 | 55.7 | 58.0 | 55.1 | 56.5 | 61.0 | 66.6 | 73.7 | 74.8 | 62.1 |
| Source: Central Institute for Meteorology and Geodynamics[3][4][5][6][7] | |||||||||||||
| Climate data for Bernstein im Burgenland (1971–2000) | |||||||||||||
|---|---|---|---|---|---|---|---|---|---|---|---|---|---|
| Month | Jan | Feb | Mar | Apr | May | Jun | Jul | Aug | Sep | Oct | Nov | Dec | Year |
| Record high °C (°F) | 16.0 (60.8) |
19.2 (66.6) |
23.0 (73.4) |
25.3 (77.5) |
28.3 (82.9) |
34.0 (93.2) |
33.5 (92.3) |
34.0 (93.2) |
30.0 (86.0) |
23.3 (73.9) |
20.4 (68.7) |
16.6 (61.9) |
34.0 (93.2) |
| Mean daily maximum °C (°F) | 1.6 (34.9) |
3.7 (38.7) |
7.9 (46.2) |
12.7 (54.9) |
17.9 (64.2) |
20.7 (69.3) |
23.0 (73.4) |
22.7 (72.9) |
18.4 (65.1) |
12.5 (54.5) |
6.0 (42.8) |
2.8 (37.0) |
12.5 (54.5) |
| Daily mean °C (°F) | −1.7 (28.9) |
−0.1 (31.8) |
3.5 (38.3) |
7.9 (46.2) |
13.0 (55.4) |
15.9 (60.6) |
18.2 (64.8) |
17.9 (64.2) |
13.8 (56.8) |
8.5 (47.3) |
2.8 (37.0) |
−0.3 (31.5) |
8.3 (46.9) |
| Mean daily minimum °C (°F) | −4.2 (24.4) |
−2.8 (27.0) |
0.4 (32.7) |
4.1 (39.4) |
9.0 (48.2) |
11.9 (53.4) |
14.0 (57.2) |
14.0 (57.2) |
10.5 (50.9) |
5.7 (42.3) |
0.4 (32.7) |
−2.7 (27.1) |
5.0 (41.0) |
| Record low °C (°F) | −19.0 (−2.2) |
−19.9 (−3.8) |
−16.5 (2.3) |
−5.4 (22.3) |
−2.0 (28.4) |
2.0 (35.6) |
6.0 (42.8) |
6.0 (42.8) |
1.5 (34.7) |
−4.7 (23.5) |
−11.8 (10.8) |
−16.7 (1.9) |
−19.9 (−3.8) |
| Average precipitation mm (inches) | 26.0 (1.02) |
26.0 (1.02) |
39.5 (1.56) |
48.0 (1.89) |
82.0 (3.23) |
114.8 (4.52) |
96.2 (3.79) |
82.5 (3.25) |
71.4 (2.81) |
47.0 (1.85) |
51.7 (2.04) |
33.2 (1.31) |
718.3 (28.28) |
| Average snowfall cm (inches) | 16.3 (6.4) |
19.0 (7.5) |
24.9 (9.8) |
8.3 (3.3) |
0.0 (0.0) |
0.0 (0.0) |
0.0 (0.0) |
0.0 (0.0) |
0.0 (0.0) |
0.2 (0.1) |
13.4 (5.3) |
21.3 (8.4) |
103.4 (40.7) |
| Average precipitation days (≥ 1.0 mm) | 4.9 | 5.0 | 7.3 | 7.6 | 9.6 | 10.1 | 9.4 | 8.7 | 6.7 | 6.1 | 7.9 | 5.8 | 89.1 |
| Average relative humidity (%) (at 14:00) | 73.8 | 65.0 | 60.1 | 55.4 | 57.3 | 58.9 | 57.0 | 57.7 | 62.3 | 66.4 | 73.2 | 74.1 | 63.4 |
| Source: Central Institute for Meteorology and Geodynamics[8] | |||||||||||||
Sightseeing
 Aerial photography of the castle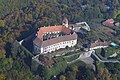
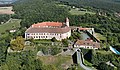 South-southwest view
.JPG)

.JPG)
Notable residents
- László Almásy (1895–1951): a Hungarian aristocrat, motorist, desert researcher, aviator, Scout-leader and soldier who served as the basis for the protagonist in Michael Ondaatje's 1992 novel The English Patient and the movie based on it.

.svg)