Bojnik, Serbia
Town and municipality in Southern and Eastern Serbia, Serbia
From Wikipedia, the free encyclopedia
Bojnik (Serbian Cyrillic: Бојник) is a town and municipality located in the Jablanica District of southern Serbia. According to 2022 census, the population of the town is 3,087 and population of the municipality was 9,315.

Bojnik
| |
|---|---|
Town and municipality | |
Bojnik | |
 Coat of arms | |
 Location of the municipality of Bojnik within Serbia | |
| Coordinates: 43°01′N 21°44′E | |
| Country |  Serbia Serbia |
| Region | Southern and Eastern Serbia |
| District | Jablanica |
| Settlements | 36 |
| Government | |
| • Mayor | Nebojša Nenadović (Independent) |
| Area | |
| • Town | 9.87 km2 (3.81 sq mi) |
| • Municipality | 264 km2 (102 sq mi) |
| Elevation | 242 m (794 ft) |
| Population (2022 census)[2] | |
| • Town | 3,087 |
| • Town density | 313/km2 (810/sq mi) |
| • Municipality | 9,315 |
| • Municipality density | 35.3/km2 (91.4/sq mi) |
| Time zone | UTC+1 (CET) |
| • Summer (DST) | UTC+2 (CEST) |
| Postal code | 16205 |
| Area code | +381(0)16 |
| Car plates | LE |
| Website | bojnik |
History
The village is mentioned in the 1884 work of M. Milićević.[3] Much of the population settled in Bojnik after World War II. On 17 February 1942, Bulgarian occupation forces massacred about 476 inhabitants of Bojnik and surroundings in response to the alleged sheltering of Partisans.[4]
Geography
The settlement of Bojnik is located in the region of Pusta Reka, and the Pusta river crosses by it.[3] The Bojnik municipality is located in southern Serbia and it is surrounded by municipality of Medveđa in the south-west, municipality of Lebane in the south, municipality of Leskovac in the east, and municipalities of Žitorađa and Prokuplje in the north.
Settlements
Aside from the town of Bojnik, the following villages consist the municipality of Bojnik:
- Borince
- Brestovac
- Vujanovo
- Gornje Brijanje
- Gornje Konjuvce
- Granica
- Dobra Voda
- Donje Konjuvce
- Dragovac
- Dubrava
- Đinđuša
- Zeletovo
- Zorovac
- Ivanje
- Kamenica
- Kacabać
- Kosančić
- Lapotince
- Lozane
- Magaš
- Majkovac
- Mijajlica
- Mrveš
- Obilić
- Obražda
- Orane
- Plavce
- Pridvorica
- Rečica
- Savinac
- Slavnik
- Stubla
- Turjane
- Ćukovac
- Crkvica
Demographics
| Year | Pop. | ±% p.a. |
|---|---|---|
| 1948 | 21,895 | — |
| 1953 | 22,329 | +0.39% |
| 1961 | 20,838 | −0.86% |
| 1971 | 18,801 | −1.02% |
| 1981 | 16,246 | −1.45% |
| 1991 | 14,498 | −1.13% |
| 2002 | 13,118 | −0.91% |
| 2011 | 11,104 | −1.83% |
| 2022 | 9,315 | −1.58% |
| Source: [5] | ||
According to the 2011 census results, the municipality has 11,104 inhabitants.
Ethnic groups
The ethnic composition of the municipality:
| Ethnic group | Population | % |
|---|---|---|
| Serbs | 9,197 | 82.83% |
| Romani | 1,649 | 14.85% |
| Montenegrins | 17 | 0.15% |
| Macedonians | 10 | 0.09% |
| Others | 231 | 2.08% |
| Total | 11,104 |
Economy
The average salary in Bojnik (2025) is significantly below the national net wage average.[6]
The following table gives a preview of total number of employed people per their core activity (as of 2017):[7]
| Activity | Total |
|---|---|
| Agriculture, forestry and fishing | 42 |
| Mining | 3 |
| Processing industry | 187 |
| Distribution of power, gas and water | 12 |
| Distribution of water and water waste management | 56 |
| Construction | 131 |
| Wholesale and retail, repair | 170 |
| Traffic, storage and communication | 17 |
| Hotels and restaurants | 11 |
| Media and telecommunications | 5 |
| Finance and insurance | 1 |
| Property stock and charter | - |
| Professional, scientific, innovative and technical activities | 21 |
| Administrative and other services | 3 |
| Administration and social assurance | 154 |
| Education | 225 |
| Healthcare and social work | 126 |
| Art, leisure and recreation | 26 |
| Other services | 20 |
| Total | 1,207 |
Gallery
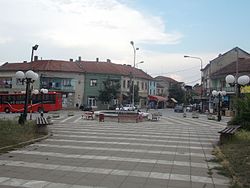 Town center
 Town center


