Cannock Chase District Council elections
Local government elections in Staffordshire, England
From Wikipedia, the free encyclopedia
Cannock Chase District Council elections are held three years out of every four, with a third of the council elected each time. Cannock Chase District Council is the local authority for the non-metropolitan district of Cannock Chase in Staffordshire, England. Since the last boundary changes in 2002, 41 councillors have been elected from 15 wards.[1]
Council elections
- 1973 Cannock Chase District Council election
- 1976 Cannock Chase District Council election (New ward boundaries)[2]
- 1978 Cannock Chase District Council election
- 1979 Cannock Chase District Council election
- 1980 Cannock Chase District Council election
- 1982 Cannock Chase District Council election
- 1983 Cannock Chase District Council election
- 1984 Cannock Chase District Council election
- 1986 Cannock Chase District Council election
- 1987 Cannock Chase District Council election
- 1988 Cannock Chase District Council election
- 1990 Cannock Chase District Council election
- 1991 Cannock Chase District Council election
- 1992 Cannock Chase District Council election
- 1994 Cannock Chase District Council election
- 1995 Cannock Chase District Council election
- 1996 Cannock Chase District Council election
- 1998 Cannock Chase District Council election
- 1999 Cannock Chase District Council election
- 2000 Cannock Chase District Council election
- 2002 Cannock Chase District Council election (New ward boundaries reduced the number of seats by 1)[3][1]
- 2003 Cannock Chase District Council election
- 2004 Cannock Chase District Council election
- 2006 Cannock Chase District Council election
- 2007 Cannock Chase District Council election
- 2008 Cannock Chase District Council election
- 2010 Cannock Chase District Council election
- 2011 Cannock Chase District Council election
- 2012 Cannock Chase District Council election
- 2014 Cannock Chase District Council election
- 2015 Cannock Chase District Council election
- 2016 Cannock Chase District Council election
- 2018 Cannock Chase District Council election
- 2019 Cannock Chase District Council election
- 2021 Cannock Chase District Council election
- 2022 Cannock Chase District Council election
- 2023 Cannock Chase District Council election
- 2024 Cannock Chase District Council election (New ward boundaries)[4]
- 2026 Cannock Chase District Council election
Composition summary
The table below shows the number of seats held by each party since the beginning of 2010. This includes district council election results, highlighted in red, as well as defections and by-elections.
| Date | Labour | Conservative | Chase Inds | Lib Dem | Greens | UKIP | Independent | Vacant | |||||||
| 13 September 2023[5] | 18 | 18 | 0 | 5 | 0 | ||||||||||
| 18 August 2023[6] | 17 | 18 | 0 | 5 | 1 | ||||||||||
| 4 May 2023 | 17 | 18 | 1 | 5 | 0 | ||||||||||
| 20 March 2023[7] | 12 | 21 | 1 | 2 | 2 | 1 | 2 | ||||||||
| 28 February 2023[8] | 12 | 22 | 2 | 2 | 2 | 1 | |||||||||
| 19 February 2023[9] | 10 | 22 | 3 | 2 | 2 | 2 | |||||||||
| 5 January 2023[10] | 10 | 23 | 3 | 2 | 2 | 1 | |||||||||
| 11 November 2022[11] | 9 | 23 | 3 | 2 | 2 | 1 | 1 | ||||||||
| 10 November 2022[12] | 9 | 24 | 3 | 2 | 2 | 1 | |||||||||
| 8 September 2022[13] | 9 | 24 | 3 | 2 | 2 | 1 | |||||||||
| 1 September 2022[14] | 8 | 23 | 3 | 2 | 2 | 1 | 2 | ||||||||
| 11 July 2022[15] | 8 | 24 | 3 | 2 | 2 | 1 | 1 | ||||||||
| 5 May 2022[16] | 8 | 25 | 3 | 2 | 2 | 1 | |||||||||
| 6 May 2021[17] | 8 | 25 | 5 | 2 | 1 | 0 | |||||||||
| 15 June 2020[18] | 17 | 14 | 5 | 2 | 1 | 1 | 1 | ||||||||
| 8 June 2020[19] | 17 | 14 | 2 | 5 | 2 | 1 | |||||||||
| 7 May 2020[20] | 18 | 14 | 2 | 5 | 1 | 1 | |||||||||
| 2 May 2019[21] | 18 | 15 | 2 | 5 | 0 | 1 | |||||||||
| 3 May 2018[22] | 21 | 15 | 1 | 3 | 0 | 1 | |||||||||
| 7 September 2017[23] | 21 | 13 | 1 | 2 | 1 | 3 | |||||||||
| 18 August 2017[24] | 20 | 15 | 1 | 1 | 1 | 3 | |||||||||
| 6 July 2017[25] | 21 | 15 | 1 | 1 | 1 | 2 | |||||||||
| 1 September 2016[26] | 21 | 13 | 1 | 1 | 3 | 2 | |||||||||
| 5 May 2016[27] | 21 | 13 | 1 | 1 | 4 | 1 | |||||||||
| 7 May 2015[28] | 22 | 12 | 1 | 0 | 5 | 1 | |||||||||
| 23 May 2014[29] | 25 | 5 | 3 | 6 | 2 | ||||||||||
| 22 May 2014[30] | 25 | 6 | 3 | 6 | 1 | ||||||||||
| 18 February 2014[31] | 24 | 9 | 3 | 3 | 2 | ||||||||||
| 30 July 2013[32] | 24 | 9 | 4 | 3 | 1 | ||||||||||
| 22 July 2013[33] | 24 | 10 | 4 | 2 | 1 | ||||||||||
| 4 July 2013[34] | 24 | 12 | 4 | 1 | |||||||||||
| 3 May 2012[35] | 24 | 12 | 5 | 0 | |||||||||||
| February 2012[36] | 17 | 13 | 9 | 2 | |||||||||||
| 5 May 2011[37] | 17 | 13 | 11 | 0 | |||||||||||
| 26 August 2010[38] | 14 | 10 | 17 | 0 | |||||||||||
| 6 May 2010[39] | 13 | 11 | 17 | 0 | |||||||||||
| 22 February 2010[40] | 14 | 7 | 19 | 1 | |||||||||||
| 26 January 2010[41] | 14 | 9 | 17 | 1 | |||||||||||
| 22 January 2010[42] | 14 | 9 | 18 | ||||||||||||
| 18 January 2010[43] | 14 | 10 | 17 | ||||||||||||
| 1 January 2010 | 14 | 12 | 15 | ||||||||||||
District result maps
 2002 results map
 2003 results map
 2004 results map
 2006 results map
 2007 results map
 2008 results map
 2010 results map
 2011 results map
 2012 results map
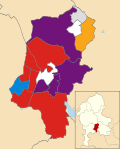 2014 results map
 2015 results map
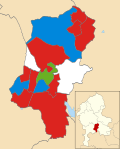 2016 results map
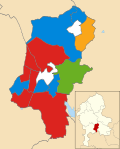 2018 results map
 2019 results map
 2021 results map
 2022 results map
 2023 results map
 2024 results map
 2026 results map


By-election results
2002-2006
| Party | Candidate | Votes | % | ±% | |
|---|---|---|---|---|---|
| Labour | 419 | 46.4 | +14.6 | ||
| Conservative | 248 | 27.5 | +4.0 | ||
| Liberal Democrats | 235 | 26.0 | +3.9 | ||
| Majority | 171 | 18.9 | |||
| Turnout | 902 | 16.9 | |||
| Labour hold | Swing | ||||
2006-2010
| Party | Candidate | Votes | % | ±% | |
|---|---|---|---|---|---|
| Labour | Gordon Ball | 397 | 45.6 | +10.2 | |
| Conservative | Kevin Daly | 243 | 27.9 | +1.8 | |
| Liberal Democrats | Reg Wells | 117 | 13.4 | −11.1 | |
| Independent | Ron Turville | 114 | 13.1 | −0.9 | |
| Majority | 154 | 17.7 | |||
| Turnout | 871 | 21.1 | |||
| Labour hold | Swing | ||||
| Party | Candidate | Votes | % | ±% | |
|---|---|---|---|---|---|
| Conservative | 654 | 60.6 | −14.1 | ||
| Labour | 333 | 30.8 | +5.5 | ||
| Liberal Democrats | 93 | 8.6 | +8.6 | ||
| Majority | 321 | 29.8 | |||
| Turnout | 1,080 | 19.4 | |||
| Conservative hold | Swing | ||||
| Party | Candidate | Votes | % | ±% | |
|---|---|---|---|---|---|
| Liberal Democrats | Chris Collis | 314 | 30.0 | +8.2 | |
| Conservative | Michelle Lucas | 300 | 28.6 | −10.9 | |
| Labour | Brian Gamble | 267 | 25.5 | −0.1 | |
| BNP | Shaun Grimsley | 116 | 11.1 | +11.1 | |
| UKIP | Sean Gleeson | 51 | 4.9 | +4.9 | |
| Majority | 14 | 1.4 | |||
| Turnout | 1,048 | 21.0 | |||
| Liberal Democrats gain from Labour | Swing | ||||
2010-2014
| Party | Candidate | Votes | % | ±% | |
|---|---|---|---|---|---|
| Labour | Diane Todd | 418 | 49.8 | +14.1 | |
| Conservative | Lisa Pearce | 238 | 28.4 | −8.7 | |
| Liberal Democrats | Andrew Clark | 153 | 18.2 | −9.0 | |
| Independent | Ron Turville | 30 | 3.6 | +3.6 | |
| Majority | 180 | 21.5 | |||
| Turnout | 839 | ||||
| Labour gain from Conservative | Swing | ||||
2014-2018
| Party | Candidate | Votes | % | ±% | |
|---|---|---|---|---|---|
| Labour | Linda Tait | 359 | 43.9 | +11.1 | |
| Conservative | Bryan Jones | 301 | 36.8 | −3.7 | |
| Green | Robert Branson | 86 | 10.5 | +7.4 | |
| Chase Independent Party | Ron Turville | 42 | 5.1 | −0.2 | |
| UKIP | David Percox | 29 | 3.5 | −14.7 | |
| Majority | 58 | 7.1 | |||
| Turnout | 821 | 19.6 | |||
| Labour gain from Conservative | Swing | ||||
| Party | Candidate | Votes | % | ±% | |
|---|---|---|---|---|---|
| Green | Stuart Crabtree | 513 | 48.3 | +42.1 | |
| Conservative | Philip Hewitt | 311 | 29.3 | −11.9 | |
| Labour | Patrick Frondigoun | 190 | 17.9 | −13.2 | |
| UKIP | John Bernard | 48 | 4.5 | −16.9 | |
| Majority | 202 | 19.0 | |||
| Turnout | 1,068 | 26.06 | |||
| Green gain from Conservative | Swing | ||||
2022-2026
| Party | Candidate | Votes | % | ±% | |
|---|---|---|---|---|---|
| Labour | Pam Johnson | 290 | 38.1 | ||
| Chase Community Independents | Darrell Mawle | 228 | 30.0 | ||
| Conservative | Laura Harrison | 208 | 27.3 | ||
| Independent | Christopher Harborow | 35 | 4.6 | ||
| Majority | 62 | 8.1 | |||
| Turnout | 761 | ||||
| Labour gain from Conservative | Swing | ||||
| Party | Candidate | Votes | % | ±% | |
|---|---|---|---|---|---|
| Conservative | Bill Kenny | 688 | 55.4 | ||
| Labour | Steven Thornley | 430 | 34.6 | ||
| Green | Eloise Cropp | 124 | 10.0 | ||
| Majority | 258 | 20.8 | |||
| Turnout | 1,242 | ||||
| Conservative hold | Swing | ||||
| Party | Candidate | Votes | % | ±% | |
|---|---|---|---|---|---|
| Labour | Darren Foley | 422 | 52.3 | ||
| Conservative | Laura Harrison | 385 | 47.7 | ||
| Majority | 37 | 4.6 | |||
| Turnout | 807 | ||||
| Labour gain from Conservative | Swing | ||||
| Party | Candidate | Votes | % | ±% | |
|---|---|---|---|---|---|
| Conservative | Samantha Thompson | 1,256 | 72.8 | ||
| Labour | Timothy Frondigoun | 469 | 27.2 | ||
| Majority | 787 | 45.6 | |||
| Turnout | 1,725 | ||||
| Conservative gain from Labour | Swing | ||||