Carlisle City Council elections
Local government elections in Cumbria, England
From Wikipedia, the free encyclopedia
Political control
The first election to the council was held in 1973, initially operating as a shadow authority alongside the outgoing authorities until the new arrangements came into effect on 1 April 1974. Political control of the council from 1974 until its abolition in 2023 was as follows:[2][3][4]
| Party in control | Years | |
|---|---|---|
| Labour | 1974–1976 | |
| No overall control | 1976–1979 | |
| Labour | 1979–1999 | |
| Conservative | 1999–2003 | |
| No overall control | 2003–2012 | |
| Labour | 2012–2019 | |
| No overall control | 2019–2021 | |
| Conservative | 2021–2023 | |
Leadership
The leaders of the council from 1999 until the council's abolition in 2023 were:
Council elections
Summary of the council composition after recent council elections, click on the year for full details of each election. Boundary changes took place for the 1999 election which increased the number of seats by one, leading to the whole council being elected in that year.[12]
- 1973 Carlisle City Council election
- 1976 Carlisle City Council election
- 1979 Carlisle City Council election
- 1983 Carlisle City Council election (New ward boundaries)[13]
- 1984 Carlisle City Council election (City boundary changes took place but the number of seats remained the same)[14]
- 1986 Carlisle City Council election
- 1987 Carlisle City Council election
- 1988 Carlisle City Council election
- 1990 Carlisle City Council election (City boundary changes took place but the number of seats remained the same)[15]
- 1991 Carlisle City Council election
| Year | Labour | Conservative | Independent | Liberal Democrats | Green Party | UKIP | Vacant | Notes |
|---|---|---|---|---|---|---|---|---|
| 1992[16] | 30 | 18 | 1 | 2 | 0 | 0 | 0 | |
| 1994[17] | 27 | 20 | 1 | 3 | 0 | 0 | 0 | |
| 1995[18] | 30 | 17 | 1 | 3 | 0 | 0 | 0 | |
| 1996[19] | 33 | 14 | 1 | 3 | 0 | 0 | 0 | |
| 1998[20] | 33 | 14 | 1 | 3 | 0 | 0 | 0 | |
| 1999[12] | 16 | 28 | 2 | 6 | 0 | 0 | 0 | New ward boundaries[21] |
| 2000[22] | 14 | 30 | 2 | 6 | 0 | 0 | 0 | |
| 2002[23] | 18 | 27 | 2 | 5 | 0 | 0 | 0 | |
| 2003[24] | 22 | 24 | 1 | 5 | 0 | 0 | 0 | |
| 2004[25] | 24 | 20 | 1 | 7 | 0 | 0 | 0 | |
| 2006[26] | 24 | 19 | 1 | 8 | 0 | 0 | 0 | |
| 2007[27] | 25 | 19 | 1 | 7 | 0 | 0 | 0 | |
| 2008[28] | 21 | 21 | 1 | 7 | 0 | 0 | 2 | |
| 2010[29] | 23 | 22 | 2 | 5 | 0 | 0 | 0 | |
| 2011[30] | 24 | 22 | 2 | 4 | 0 | 0 | 0 | |
| 2012[31] | 27 | 20 | 2 | 2 | 0 | 0 | 1 | |
| 2014[3] | 29 | 19 | 2 | 2 | 0 | 0 | 0 | |
| 2015[32] | 29 | 20 | 2 | 1 | 0 | 0 | 0 | |
| 2016 | 28 | 20 | 3 | 1 | 0 | 0 | 0 | |
| 2018 | 27 | 21 | 3 | 1 | 0 | 0 | 0 | |
| 2019[33] | 15 | 17 | 4 | 1 | 1 | 1 | 0 | New ward boundaries[34] |
District result maps
 2002 results map
 2003 results map
 2004 results map
 2006 results map
 2007 results map
 2008 results map
 2010 results map
 2011 results map
 2012 results map
 2014 results map
 2015 results map
 2016 results map
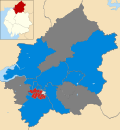 2018 results map
 2019 results map


By-election results
By-elections occur when seats become vacant between council elections. Below is a summary of recent by-elections;[35] full by-election results can be found by clicking on the by-election name.
A detailed breakdown of recent by elections can be found below:
| Election | Political result | Candidate | Party | Votes | % | ±% | ||
|---|---|---|---|---|---|---|---|---|
| Castle & Cathedral by-election, 6 May 2021[36] triggered by the resignation of Cllr. Chris Robinson Turnout: 1,713 (25.9%) | Labour hold Majority: 74 (39.3%) 4.3 | Pete Sunter | Labour | 673 | 39.3 | +4.7 | ||
| Hugh McKerrell | Conservative | 599 | 35 | +19.6 | ||||
| Gavin Hawkton | Green | 299 | 17.5 | -0.7 | ||||
| Stuart Kelly | Liberal Democrats | 95 | 5.5 | -3.0 | ||||
| Harraby South and Parklands by-election, 6 May 2021[37] Electorate: 6,628 Turnout: 1,926 (29.06%) | Conservative gain from Labour Party (UK) Majority: 276 (53.4%) | Linda Mitchell | Conservative | 1028 | 53.4 | |||
| Abdul Harid | Labour | 752 | 39 | |||||
| Anne Gadsden | Green | 132 | 6.9 | |||||
| Newton & Morton North by-election, 6 May 2021[37] Electorate: 6,844 Turnout: 1,805 (26.37%) | Conservative gain from Labour Party (UK) Majority: 116 (48.9%) | Neville Lishman | Conservative | 883 | 48.9 | |||
| David Graham | Labour | 767 | 42.5 | |||||
| Fiona Prior | Green | 101 | 5.6 | |||||
| Brent Kennedy | TUSC | 40 | 2.2 | |||||
| Currock & Upperby by-election, 28 October 2021[38] triggered by the death of incumbent Cllr. John Denholm Electorate: 6,550 Turnout: 1,111 (16.96%) | Labour gain from UK Independence Party Majority: 224 (57.5%) +20.7 | Chris Wills | Labour | 636 | 57.5 | +20.7 | ||
| Geoff Mitchell | Conservative | 412 | 57.5 | +22.2 | ||||
| Tom Adams | Green | 59 | 5.3 | -6.3 | ||||
| Longtown & the Border by-election, 5 May 2022[39] triggered by the death of incumbent Cllr. Valerie Tarbitt Electorate: 5,794 Turnout: 2,218 (38.30%) | Liberal Democrats gain from Conservatives Majority: 299 (13.6%) | Timothy Pickstone | Liberal Democrats | 1,247 | 56.8 | +56.8 | ||
| Sam Bown | Conservative | 948 | 43.2 | -1.5 | ||||