Cell Transmission Model
From Wikipedia, the free encyclopedia
Cell Transmission Model (CTM) is a popular numerical method proposed by Carlos Daganzo[1] to solve the kinematic wave equation.[2][3] Lebacque[4] later showed that CTM is the first order discrete Godunov approximation.[5]
CTM predicts macroscopic traffic behavior on a given corridor by evaluating the flow and density at finite number of intermediate points at different time steps. This is done by dividing the corridor into homogeneous sections (hereafter called cells) and numbering them i=1, 2… n starting downstream. The length of the cell is chosen such that it is equal to the distance traveled by free-flow traffic in one evaluation time step. The traffic behavior is evaluated every time step starting at t=1,2…m. Initial and boundary conditions are required to iteratively evaluate each cell.
The flow across the cells is determined based on μ(k) and λ(k), two monotonic functions that uniquely define the fundamental diagram as shown in Figure 1. The density of the cells is updated based on the conservation of inflows and outflows. Thus, the flow and density are derived as:
Where:
and represent density and flow in cell i at time t. Similarly $f_k$, , ,and represents jam density, capacity, wave speed, and free-flow speed respectively of the fundamental diagram.
 Figure 1. Demand and supply functions (Figure obtained from Laval [6]

CTM produces results consistent with the continuous Kinematic wave equation when the density specified in the initial condition changes gradually. However, CTM replicates discontinuities and shock that take a span of few cells of space but moves at correct speed predicted by the Kinematic wave equation.
It was observed that as time passes, the CTM approximations result in spreading the shock to a growing number of cells. To eliminate spreading of certain shocks, Daganzo (1994) proposed a modification to the CTM that ensures shocks separating a lower upstream density and greater downstream density do not spread.
CTM is robust and the simulation results do not depend on the order in which the cells are evaluated because the flow entering a cell is dependent only on the current conditions within the cell and is unrelated to the flow exiting the cell. Thus, CTM can be applied for the analysis of complex networks and non-concave fundamental diagrams.
Implementation and Example
Consider a 2.5 kilometer homogeneous arterial segment that follows a triangular fundamental diagram as shown in figure 2.
Figure 2. Fundamental diagram for the example
This corridor is divided into 30 cells and is simulated for 480 seconds with a time step of 6 seconds. The Initial and boundary conditions are specified as follows: K(x,0)=48 x K(0,t)=48 t K(2.5,t)=0 t
The corridor has two signals located at milepost 1 and 2 starting upstream. The signals have a split of 30 seconds and a cycle length of 60 second. With this information, it is a simple matter of iteration of equations (1) for all the cells and time steps. Figure 3 and Table 1 shows the spatial and temporal distribution of density for the case of offset=0 seconds.
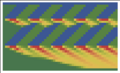 Figure 3. Density plot for the example with offset of 0 seconds

Table 1: Density values for the example with offset of 0 seconds
Currently, some software tools (For example: TRANSYT-14 and SIGMIX) evaluating traffic or optimizing traffic signal settings applies CTM as its macroscopic traffic simulator. For example, in TRANSYT-14 (Note not to be confused with TRANSYT-7F releases), the user is allowed to choose traffic models including CTM, Platoon Dispersion...etc. to model the traffic dynamics.[7] In SIGMIX, it is by default using CTM as simulator.[8]