Cherwell District Council elections
Local government elections in Oxfordshire, England
From Wikipedia, the free encyclopedia
One third of Cherwell District Council in Oxfordshire, England is elected each year, followed by one year without election. Since the last comprehensive boundary changes in 2016, 48 councillors have been elected from 16 wards.[1]
Council elections
| Year | Conservative | Labour | Liberal Democrats[a] | Green[b] | Independents & Others |
Council control after election | ||
|---|---|---|---|---|---|---|---|---|
| Local government reorganisation; council established (45 seats) | ||||||||
| 1973 | 16 | 16 | 0 | – | 13 | No overall control | ||
| 1976 | 26 | 10 | 0 | 0 | 9 | Conservative | ||
| New ward boundaries (52 seats)[3] | ||||||||
| 1979 | 34 | 12 | 2 | 0 | 4 | Conservative | ||
| 1980 | 31 | 16 | 2 | 0 | 3 | Conservative | ||
| 1982 | 30 | 15 | 4 | 0 | 3 | Conservative | ||
| 1983 | 32 | 16 | 3 | 0 | 1 | Conservative | ||
| 1984 | 35 | 12 | 4 | 0 | 1 | Conservative | ||
| 1986[4] | 32 | 13 | 6 | 0 | 1 | Conservative | ||
| 1987 | 33 | 12 | 7 | 0 | 0 | Conservative | ||
| 1988[5] | 32 | 14 | 2 | 0 | 4 | Conservative | ||
| 1990 | 32 | 17 | 2 | 0 | 1 | Conservative | ||
| 1991[6] | 28 | 18 | 3 | 0 | 3 | Conservative | ||
| 1992 | 32 | 15 | 3 | 0 | 2 | Conservative | ||
| 1994 | 31 | 16 | 4 | 0 | 1 | Conservative | ||
| 1995 | 23 | 22 | 7 | 0 | 0 | No overall control | ||
| 1996 | 16 | 28 | 8 | 0 | 0 | Labour | ||
| 1998 | 17 | 24 | 7 | 0 | 4 | No overall control | ||
| 1999 | 26 | 19 | 5 | 0 | 2 | No overall control | ||
| 2000 | 33 | 13 | 4 | 0 | 2 | Conservative | ||
| New ward boundaries (52 seats)[7][8] | ||||||||
| 2002 | 37 | 11 | 2 | 0 | 0 | Conservative | ||
| 2003 | 34 | 12 | 4 | 0 | 0 | Conservative | ||
| 2004 | 36 | 10 | 4 | 0 | 0 | Conservative | ||
| 2006 | 38 | 8 | 4 | 0 | 0 | Conservative | ||
| 2007 | 42 | 4 | 4 | 0 | 0 | Conservative | ||
| 2008 | 44 | 2 | 4 | 0 | 0 | Conservative | ||
| 2010 | 44 | 2 | 4 | 0 | 0 | Conservative | ||
| 2011 | 43 | 4 | 3 | 0 | 0 | Conservative | ||
| 2012 | 41 | 6 | 3 | 0 | 0 | Conservative | ||
| 2014 | 40 | 7 | 2 | 0 | 1 | Conservative | ||
| 2015 | 41 | 7 | 1 | 0 | 1 | Conservative | ||
| New ward boundaries (48 seats)[1] | ||||||||
| 2016 | 38 | 8 | 0 | 0 | 2 | Conservative | ||
| 2018 | 37 | 9 | 1 | 0 | 1 | Conservative | ||
| 2019 | 32 | 9 | 3 | 1 | 3 | Conservative | ||
| 2021 | 32 | 9 | 3 | 1 | 3 | Conservative | ||
| 2022 | 25 | 10 | 7 | 2 | 4 | Conservative | ||
| 2023 | 20 | 12 | 10 | 3 | 3 | No overall control | ||
| 2024 | 11 | 13 | 17 | 4 | 3 | No overall control | ||
| 2026 | ||||||||
Results maps
 2002 results map
 2003 results map
 2004 results map
 2006 results map
 2007 results map
 2008 results map
 2010 results map
 2011 results map
 2012 results map
 2014 results map
 2015 results map
 2016 results map
 2018 results map
 2019 results map
 2021 results map
 2022 results map
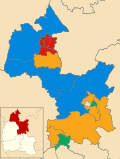 2023 results map
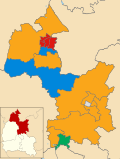 2024 results map


By-election results
1994-1998
| Party | Candidate | Votes | % | ±% | |
|---|---|---|---|---|---|
| Liberal Democrats | 170 | 32.0 | |||
| Conservative | 169 | 31.8 | |||
| Independent | 100 | 18.8 | |||
| Labour | 91 | 17.1 | |||
| Majority | 1 | 0.2 | |||
| Turnout | 530 | 50.0 | |||
| Liberal Democrats gain from Conservative | Swing | ||||
| Party | Candidate | Votes | % | ±% | |
|---|---|---|---|---|---|
| Conservative | Maurice Billington | 455 | 38.4 | −1.1 | |
| Labour | John Stansby | 450 | 38.0 | −7.8 | |
| Liberal Democrats | John Wyse | 280 | 23.6 | +8.9 | |
| Majority | 5 | 0.4 | |||
| Turnout | 1,185 | 27.3 | |||
| Conservative gain from Labour | Swing | ||||
1998-2002
| Party | Candidate | Votes | % | ±% | |
|---|---|---|---|---|---|
| Conservative | 382 | 51.9 | +24.3 | ||
| Labour | 306 | 41.6 | −22.0 | ||
| Liberal Democrats | 48 | 6.5 | −2.4 | ||
| Majority | 76 | 10.3 | |||
| Turnout | 736 | ||||
| Conservative gain from Labour | Swing | ||||
| Party | Candidate | Votes | % | ±% | |
|---|---|---|---|---|---|
| Liberal Democrats | 290 | 36.3 | −24.2 | ||
| Independent | 263 | 32.8 | +32.8 | ||
| Conservative | 247 | 30.9 | −8.6 | ||
| Majority | 27 | 3.5 | |||
| Turnout | 800 | 47.0 | |||
| Liberal Democrats hold | Swing | ||||
| Party | Candidate | Votes | % | ±% | |
|---|---|---|---|---|---|
| Conservative | 422 | 58.4 | −2.1 | ||
| Labour | 183 | 25.3 | −1.6 | ||
| Liberal Democrats | 117 | 16.2 | +3.5 | ||
| Majority | 239 | 33.1 | |||
| Turnout | 722 | 14.0 | |||
| Conservative hold | Swing | ||||
2002-2006
| Party | Candidate | Votes | % | ±% | |
|---|---|---|---|---|---|
| Conservative | Michael Gibbard | 784 | 59.8 | +12.6 | |
| Liberal Democrats | Suzanne Wilson-Higgins | 423 | 32.3 | −11.1 | |
| Labour | Catherine Arakelian | 103 | 7.9 | −1.5 | |
| Majority | 361 | 27.5 | |||
| Turnout | 1,310 | 31.0 | |||
| Conservative gain from Liberal Democrats | Swing | ||||
2006-2010
| Party | Candidate | Votes | % | ±% | |
|---|---|---|---|---|---|
| Conservative | Simon Holland | unopposed | |||
| Conservative hold | Swing | ||||
| Party | Candidate | Votes | % | ±% | |
|---|---|---|---|---|---|
| Liberal Democrats | Douglas Williamson | 828 | 49.2 | −1.0 | |
| Conservative | Trevor Elford | 690 | 41.0 | +2.2 | |
| Labour | Andrew Hornsby-Smith | 165 | 9.8 | −1.2 | |
| Majority | 138 | 8.2 | |||
| Turnout | 1,683 | 40.7 | |||
| Liberal Democrats hold | Swing | ||||
2010-2014
| Party | Candidate | Votes | % | ±% | |
|---|---|---|---|---|---|
| Liberal Democrats | Alaric Rose | 526 | 42.2 | −11.4 | |
| Conservative | Eddie Stevens | 419 | 33.6 | −12.8 | |
| Labour | Catherine Arakelian | 216 | 17.3 | +17.3 | |
| UKIP | David Fairweather | 86 | 6.9 | +6.9 | |
| Majority | 107 | 8.6 | |||
| Turnout | 1,247 | ||||
| Liberal Democrats hold | Swing | ||||
| Party | Candidate | Votes | % | ±% | |
|---|---|---|---|---|---|
| Conservative | Melanie Magee | 443 | 65.9 | +7.0 | |
| Labour | Kevin Walsh | 130 | 19.3 | −5.8 | |
| Liberal Democrats | John Innes | 99 | 14.7 | −1.3 | |
| Majority | 313 | 46.6 | |||
| Turnout | 672 | ||||
| Conservative hold | Swing | ||||
| Party | Candidate | Votes | % | ±% | |
|---|---|---|---|---|---|
| Conservative | Ray Jelf | 511 | 66.6 | +8.1 | |
| Labour | Perran Moon | 155 | 20.2 | −11.1 | |
| Green | Colin Clark | 101 | 13.2 | +13.2 | |
| Majority | 356 | 46.4 | |||
| Turnout | 767 | ||||
| Conservative hold | Swing | ||||
2014-2018
| Party | Candidate | Votes | % | ±% | |
|---|---|---|---|---|---|
| Labour | Shaida Hussain | 781 | 45.0 | +8.3 | |
| Conservative | Tony Mepham | 661 | 38.1 | +3.1 | |
| UKIP | Linda Wren | 150 | 8.6 | −6.3 | |
| Liberal Democrats | Kenneth Ashworth | 73 | 4.2 | −1.3 | |
| Green | Christopher Manley | 72 | 4.1 | −3.8 | |
| Majority | 120 | 6.9 | |||
| Turnout | 1,737 | ||||
| Labour gain from Conservative | Swing | ||||
| Party | Candidate | Votes | % | ±% | |
|---|---|---|---|---|---|
| Conservative | Andrew McHugh | 1,015 | 57.4 | +8.5 | |
| Labour | Sue Christie | 286 | 16.2 | −0.2 | |
| Green | Naomi Kanetsuka | 278 | 15.7 | −5.5 | |
| Liberal Democrats | Ian Thomas | 189 | 10.7 | −2.8 | |
| Majority | 729 | 41.2 | |||
| Turnout | 1,768 | ||||
| Conservative hold | Swing | ||||
2022-2026
| Party | Candidate | Votes | % | ±% | |
|---|---|---|---|---|---|
| Conservative | Fiaz Ahmed | 729 | 33.3 | +9.0 | |
| Labour | Andrew Eaton | 690 | 31.5 | −16.9 | |
| Independent | Simon Garrett | 412 | 18.8 | +7.4 | |
| Liberal Democrats | Ian Thomas | 358 | 16.4 | +10.1 | |
| Majority | 39 | 1.8 | |||
| Turnout | 2,189 | ||||
| Conservative gain from Labour | Swing | ||||
| Party | Candidate | Votes | % | ±% | |
|---|---|---|---|---|---|
| Labour | Henry Elugwu | 639 | 32.8 | −11.9 | |
| Conservative | Paul Sargent | 600 | 30.8 | +10.3 | |
| Independent | Cassi Bellingham | 289 | 14.8 | +2.8 | |
| Liberal Democrats | Sophie Parker-Manuel | 216 | 11.1 | −2.4 | |
| Green | Karl Kwiatkowski | 207 | 10.6 | +1.3 | |
| Majority | 39 | 2.0 | |||
| Turnout | 1,951 | ||||
| Labour hold | Swing | ||||
| Party | Candidate | Votes | % | ±% | |
|---|---|---|---|---|---|
| Conservative | Zoe McLernon | 1,560 | 46.9 | +3.1 | |
| Liberal Democrats | Nick Mylne | 916 | 27.6 | +15.0 | |
| Labour | Helen Oldfield | 478 | 14.4 | −18.8 | |
| Green | Aaron Bliss | 370 | 11.1 | +0.7 | |
| Majority | 644 | 19.4 | |||
| Turnout | 3,324 | ||||
| Conservative hold | Swing | ||||