Chivay
From Wikipedia, the free encyclopedia
Chivay | |
|---|---|
Town | |
.jpg) View of Chivay | |
_(2003).svg) Flag | |
 Chivay | |
| Coordinates: 15°38′S 71°36′W / 15.633°S 71.600°W | |
| Country | |
| Region | Arequipa |
| Province | Caylloma |
| District | Chivay |
| Government | |
| • Mayor | Jorge Modesto Cueva Tejada |
| Elevation | 3,635 m (11,926 ft) |
| Population | |
• Total | 5,000 |
| Time zone | UTC-5 (PET) |
Chivay is a town in the Colca valley, capital of the Caylloma province in the Arequipa region, Peru. Located at about 3,600 m above sea level (12,000 ft), it lies upstream of the renowned Colca Canyon. It has a central town square and an active market. Ten km to the east, and 1,500 metres above the town of Chivay lies the Chivay obsidian source.
Thermal springs are located 3 km from town; a number of heated pools have been constructed. A stone "Inca" bridge crosses the Colca River ravine, just to the north of the town. The town is a popular staging point for tourists visiting Condor Cross or Cruz Del Condor, where condors can be seen catching thermal uplifts a few kilometres downstream.[citation needed]
Chivay has a subtropical highland climate (Köppen: Cwb)[1] characterized by mild days, cold nights, and distinct wet and dry seasons.
The total annual precipitation is around 450 millimetres (18 in). Chivay receives the majority of its precipitation during the wet season, which spans from December to March. The dry season, from May to November, sees significantly reduced precipitation.[2]
Daytime temperatures are relatively constant throughout the year, with all months having average high temperatures close to 20 °C (68 °F). The dry season has significantly colder nights than the wet season, with average low temperatures below freezing from May to August. Low temperatures average above 4 °C (39 °F) during the wet season.[2]
| Climate data for Chivay (1991–2020) | |||||||||||||
|---|---|---|---|---|---|---|---|---|---|---|---|---|---|
| Month | Jan | Feb | Mar | Apr | May | Jun | Jul | Aug | Sep | Oct | Nov | Dec | Year |
| Mean daily maximum °C (°F) | 19.0 (66.2) |
18.6 (65.5) |
19.1 (66.4) |
19.8 (67.6) |
19.6 (67.3) |
19.1 (66.4) |
19.0 (66.2) |
20.1 (68.2) |
21.0 (69.8) |
21.5 (70.7) |
21.6 (70.9) |
20.6 (69.1) |
19.9 (67.8) |
| Mean daily minimum °C (°F) | 4.5 (40.1) |
4.7 (40.5) |
4.0 (39.2) |
2.6 (36.7) |
−0.2 (31.6) |
−1.7 (28.9) |
−1.8 (28.8) |
−0.8 (30.6) |
0.9 (33.6) |
1.9 (35.4) |
2.4 (36.3) |
3.7 (38.7) |
1.7 (35.1) |
| Average precipitation mm (inches) | 115.0 (4.53) |
116.9 (4.60) |
86.2 (3.39) |
29.8 (1.17) |
2.9 (0.11) |
2.3 (0.09) |
3.5 (0.14) |
3.0 (0.12) |
7.6 (0.30) |
10.4 (0.41) |
13.9 (0.55) |
54.2 (2.13) |
445.7 (17.55) |
| Source: NOAA[2] | |||||||||||||
Gallery
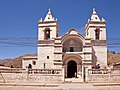 Church in Chivay
 "Puente Inca" near Chivay
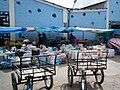 Chivay market
 Temple Santiago Apostol de Caporaque in Chivay
 Ruins of a ring of terraces often incorrectly called a "bullring" or amphitheater; part of the Chivay Ruinas park overlooking Chivay, north side of Rio Colca


