City of Wagga Wagga
Local government area in New South Wales, Australia
From Wikipedia, the free encyclopedia
City of Wagga Wagga is a local government area in the Riverina region of southern New South Wales, Australia.

Wagga Wagga | |||||||||||||
|---|---|---|---|---|---|---|---|---|---|---|---|---|---|
|
| |||||||||||||
| Coordinates: 35°08′S 147°22′E | |||||||||||||
| Country | Australia | ||||||||||||
| State | New South Wales | ||||||||||||
| Region | Riverina | ||||||||||||
| Established | 15 March 1870 (Borough)[1] 17 April 1946 (City)[2] | ||||||||||||
| Council seat | Wagga Wagga[3] | ||||||||||||
| Government | |||||||||||||
| • Mayor | Dallas Tout[4] | ||||||||||||
| • State electorate | |||||||||||||
| • Federal division | |||||||||||||
| Area | |||||||||||||
• Total | 4,825.9 km2 (1,863.3 sq mi) | ||||||||||||
| Population | |||||||||||||
| • Totals | 62,385 (2016)[6] 70,339 (2022 est.)[7] | ||||||||||||
| • Density | 12.92712/km2 (33.4811/sq mi) | ||||||||||||
| Website | Wagga Wagga | ||||||||||||
| |||||||||||||
The mayor of the City of Wagga Wagga is Dallas Tout, an independent politician.[4]
City, town and localities
The City of Wagga Wagga includes the suburbs of
History
Wagga Wagga was first incorporated as the Borough of Wagga Wagga on 15 March 1870.[8] It received city status and became the City of Wagga Wagga on 17 April 1946. The municipality enlarged substantially on 1 January 1981 when the adjoining Shire of Kyeamba and Shire of Mitchell were amalgamated into the City.[9]
Heritage listings
The City of Wagga Wagga has a number of heritage-listed sites, including:
- Bomen, Main Southern railway: Bomen railway station[10]
- Tarcutta, Tarcutta Street: Hambledon Homestead[11]
- Wagga Wagga, Botanic Gardens Site (BGS), Baden Powell Drive: Mobile Cook's Galley, Museum of the Riverina[12]
- Wagga Wagga, Main Southern railway: Wagga Wagga railway station[13]
Demographics
At the 2021 census, there were 69,047 people in the City of Wagga Wagga local government area, of these 48.6% were male and 51.4% were female. Aboriginal and Torres Strait Islander people made up 6.6% of the population, close to twice the national average of 3.2%. The median age of people in the City of Wagga Wagga was 35 years, which was lower than the national median of 38 years. Children aged 0 – 14 years made up 20.3% of the population and people aged 65 years and over made up 15.2% of the population. Of people in the area aged 15 years and over, 44.8% were married and 11.3% were either divorced or separated.[14]
At the 2021 Census, 40.0% of residents stated their ancestry as Australian. Excluding not stated responses, 60.9% of residents in the City of Wagga Wagga nominated a religious affiliation with Christianity, which was higher than the national average of 47.1%. 85.3% of households only speak English at home, higher than the national average of 72%.[14]
| Selected historical census data for the City of Wagga Wagga local government area | |||||||
|---|---|---|---|---|---|---|---|
| Census year | 2001[15] | 2006[16] | 2011[17] | 2016[18] | 2021[14] | ||
| Population | Estimated residents on census night | 54,845 |  57,015 57,015 | 59,458 | 62,385 | 67,609 | |
| LGA rank in terms of size within New South Wales | 39th |  38th 38th | |||||
| % of New South Wales population | 0.87% |  0.87% 0.87% | 0.86% | 0.83% | 0.84% | ||
| % of Australian population | 0.29% | 0.29% | 0.28% | 0.27% | 0.27% | ||
| Estimated ATSI population on census night | 1,767 | 2,336 | 2,731 | 3,508 | 4,471 | ||
| % of ATSI population to residents | 3.2% | 4.1% | 4.6% | 5.6% | 6.6% | ||
| Median weekly incomes | |||||||
| Personal income | Median weekly personal income | No Data | A$463 | A$586 | A$696 | A$839 | |
| % of Australian median income | 99.36% | 101.56% | 105.14% | 104.22% | |||
| Family income | Median weekly family income | A$1,137 | A$1,418 | A$1,682 | A$2,060 | ||
| % of Australian median income | 97.10% | 95.75% | 97.00% | 97.17% | |||
| Household income | Median weekly household income | A$967 | A$1,149 | A$1,354 | A$1,638 | ||
| % of Australian median income | 94.16% | 93.11% | 94.16% | 93.81% | |||
| Dwelling structure | |||||||
| Dwelling type | Flat or apartment | 8.8% | 10.9% | 10.3% | 9.8% | 9.2% | |
| Semi-detached, terrace or townhouse | 4.6% | 4.1% | 4.2% | 4.1% | 4.8% | ||
| Separate house | 84.5% | 84.2% | 84.8% | 84.9% | 85.5% | ||
| Other dwellings | 0.8% | 0.9% | 0.6% | 0.9% | 0.4% | ||
| Unoccupied dwellings | 8.3% | 8.2% | 9.7% | 10.2% | 7.5% | ||
| Selected historical census data for the City of Wagga Wagga local government area | |||||||||
|---|---|---|---|---|---|---|---|---|---|
| Ancestry, top responses | |||||||||
| 2001 | 2006 | 2011[19] | 2016[20] | 2021[14] | |||||
| No Data | No Data | Australian[N 1] | 45.4% | Australian | 43.1% | Australian | 40.0% | ||
| English | 38.8% | English | 39.7% | English | 39.4% | ||||
| Irish | 13.8% | Irish | 14.3% | Irish | 12.9% | ||||
| Scottish | 10.1% | Scottish | 10.7% | Scottish | 10.7% | ||||
| German | 5.4% | German | 5.3% | Aboriginal[N 2] | 6.4% | ||||
| Country of Birth, top responses | |||||||||
| 2001[15] | 2006[16] | 2011[17] | 2016[18] | 2021[14] | |||||
| Australia | 89.3% | Australia | 88.9% | Australia | 87.8% | Australia | 84.1% | Australia | 83.0% |
| England | 1.5% | England | 1.5% | England | 1.4% | England | 1.3% | India | 1.5% |
| New Zealand | 0.7% | New Zealand | 0.7% | New Zealand | 0.7% | India | 1.0% | Iraq | 1.2% |
| Scotland | 0.3% | India | 0.3% | India | 0.5% | New Zealand | 0.7% | England | 1.2% |
| Netherlands | 0.3% | Scotland | 0.3% | China | 0.4% | Philippines | 0.7% | New Zealand | 0.7% |
| Germany | 0.2% | Netherlands | 0.2% | South Africa | 0.3% | China | 0.4% | Philippines | 0.7% |
| Language, top responses (other than English) | |||||||||
| 2001[15] | 2006[16] | 2011[17] | 2016[18] | 2021[14] | |||||
| Italian | 0.3% | Arabic | 0.3% | Arabic | 0.5% | Malayalam | 0.6% | Kurdish | 1.0% |
| Greek | 0.2% | Mandarin | 0.2% | Mandarin | 0.4% | Mandarin | 0.5% | Malayalam | 0.8% |
| Cantonese | 0.2% | Cantonese | 0.2% | Cantonese | 0.2% | Arabic | 0.5% | Mandarin | 0.6% |
| Mandarin | 0.1% | Italian | 0.2% | Hindi | 0.2% | Tagalog | 0.3% | Arabic | 0.5% |
| German | 0.1% | Greek | 0.1% | German | 0.2% | Filipino | 0.3% | Punjabi | 0.4% |
| Religious affiliation, top responses | |||||||||
| 2001[15] | 2006[16] | 2011[17] | 2016[18] | 2021[14] | |||||
| Catholic | 33.5% | Catholic | 33.4% | Catholic | 33.2% | Catholic | 30.6% | No Religion | 31.3% |
| Anglican | 26.6% | Anglican | 25.5% | Anglican | 23.9% | No Religion | 22.2% | Catholic | 27.1% |
| No Religion | 9.4% | No Religion | 11.6% | No Religion | 15.0% | Anglican | 19.5% | Anglican | 15.3% |
| Presbyterian/Reformed | 7.6% | Presbyterian/
Reformed |
7.1% | Uniting Church | 5.5% | Presbyterian/
Reformed |
4.9% | Presbyterian/
Reformed |
3.8% |
| Uniting Church | 7.1% | Uniting Church | 6.4% | Presbyterian/
Reformed |
4.9% | Uniting Church | 4.5% | Uniting Church | 3.4% |
| Not Stated | n/c | Not Stated | n/c | Not Stated | n/c | Not Stated | 7.9% | Not Stated | 6.4% |
Council

Current composition and election method
Wagga Wagga City Council (WWCC) is composed of nine councillors elected proportionally as a single ward. All councillors are elected for a fixed four-year term of office. The mayor is elected by the councillors at the first meeting of the council. The most recent election was held on 4 December 2021, and the makeup of the council is as follows:[21]
| Party | Councillors | |
|---|---|---|
| Independents | 5 | |
| Labor Party | 2 | |
| Getting It Done | 1 | |
| Greens | 1 | |
| Total | 9 | |
The current Council, elected in 2021, is:[21]
| Councillor | Party | Notes | |
|---|---|---|---|
| Dallas Tout | Independent | Mayor[22] | |
| Jenny McKinnon | Greens | Deputy Mayor | |
| Dan Hayes | Labor | ||
| Amelia Parkins | Labor | ||
| Richard Foley | Independent | ||
| Tim Koschel | Independent | ||
| Michael Henderson | Independent | ||
| Rod Kendall | Independent | ||
| Georgie Davis | Getting It Done | ||
A referendum was held on 8 September 2012 and an absolute majority of voters resolved in favour to reduce the number of councillors from eleven to nine.[23] The change came into effect at the September 2016 elections.
Administration staff
In December 2009, Wagga Wagga City Council announced that it had appointed Phil Pinyon as the general manager of the Wagga Wagga City Council replacing Lyn Russell, who suddenly announced her resignation in October 2009, after completing 18 months of her five-year contract.[24][25][26]
Cutting ties with China's Sister City
In April 2020, The Wagga council voted to cut ties with China's Kunming city; a week later they would vote again joining Kunming as a sister city.[27][28][29]
Election results
2024
| Party | Candidate | Votes | % | ±% | |
|---|---|---|---|---|---|
| Your Voice Matters To Us | 1. Timothy Koschel (elected 1) 2. Allana Condron (elected 5) 3. Mick Henderson 4. Chris Ingram 5. Jacinta Evans |
8,369 | 22.9 | +14.1 | |
| Community First | 1. Dallas Tout (elected 2) 2. Karissa Subedi (elected 9) 3. Marie (Pascale) Vythilingum 4. Megan Norton 5. Nin Nin Sang Dong |
5,952 | 16.3 | +6.3 | |
| Labor | 1. Amelia Parkins (elected 3) 2. Tim Kurylowicz 3. Peita Vincent 4. Steven Dale 5. Mark Jeffreson |
4,716 | 12.9 | −10.1 | |
| Getting It Done | 1. Georgina Davies (elected 4) 2. Karen Butts 3. Pradeep Kurien 4. Sarah Humphries 5. Steve Taylor |
4,412 | 12.1 | +5.7 | |
| Foley's Five | 1. Richard Foley (elected 6) 2. Christopher Kanck 3. Shahnaz Akter 4. Wayne Deaner 5. Alisha Watkins |
2,984 | 8.2 | −15.8 | |
| Greens | 1. Jenny McKinnon (elected 7) 2. Sam Ryot 3. George Benedyka 4. Virginia Gawler 5. Emma Rush |
2,279 | 6.2 | −3.1 | |
| Building Tomorrow Together | 1. Lindsay Tanner (elected 8) 2. Ali Tanner 3. Clare Lawlor 4. Michael Nugent 5. Andrew Roberts |
2,144 | 5.9 | +5.9 | |
| Christians | 1. Paul McCausland 2. Christopher Cowell 3. Paul Cocks 4. Dorcas Musyimi 5. Darcy Maybon |
1,585 | 4.3 | +4.3 | |
| Fix Our Roads | 1. Robert Sinclair 2. Kane Salamon 3. Rosina Gordon 4. Julie Sinclair 5. Cassidy Turner |
1,514 | 4.1 | +4.1 | |
| Supporting Diversity | 1. Rory McKenzie 2. Samuel Avo 3. Gail Manderson 4. Midya Bari 5. Anna Gannon |
939 | 2.6 | −9.7 | |
| Ready To Serve | 1. Ryan Dedini 2. Kelly O'Kane 3. Andrew Tuovi 4. John Kennedy 5. Sarah-Jane Jameson |
832 | 2.3 | +2.3 | |
| Voice of Wagga Residents | 1. Saba Nabi 2. Singh Manjinder 3. Birenbhai Patel 4. Priyanka Udeniya 5. Hina Ashfaq |
640 | 1.7 | +1.7 | |
| Independent | Rosyln Prangnell | 159 | 0.4 | +0.4 | |
| Total formal votes | 36,525 | 91.9 | |||
| Informal votes | 3,233 | 8.1 | |||
| Turnout | 39,758 | ||||
2021
| Elected councillor | Party | |
|---|---|---|
| Michael Henderson | Clean Out Council | |
| Richard Foley | Clean Out Council | |
| Dan Hayes | Labor | |
| Amelia Parkins | Labor | |
| Rod Kendall | Independent (Group D) | |
| Dallas Tout | Community First | |
| Jenny McKinnon | Greens | |
| Tim Koschel | Here For You | |
| Georgie Davis | Getting It Done | |
| Party | Candidate | Votes | % | ±% | |
|---|---|---|---|---|---|
| Clean Out Council | 9,201 | 25.6 | |||
| Labor | 8,279 | 23.1 | +6.1 | ||
| Independent (Group D) | 4,416 | 12.3 | |||
| Community First | 3,576 | 10.0 | |||
| Greens | 3,347 | 9.3 | +5.0 | ||
| Here For You | 2,808 | 7.8 | |||
| Getting It Done | 2,291 | 6.4 | |||
| Independent (Group F) | 837 | 2.3 | +2.3 | ||
| Independent Liberal | Robert Sinclair | 572 | 1.6 | ||
| Independent Liberal | Rosina Gordon | 287 | 0.8 | ||
| Independent | Richard Salcole | 235 | 0.7 | ||
| Independent Liberal | Robin Dennis | 20 | 0.1 | ||
| Independent Liberal | Daniel Vieria | 16 | 0.0 | ||
| Total formal votes | 35,885 | 93.2 | |||
| Informal votes | 2,634 | 6.8 | |||
| Turnout | 38,519 | 83.3 | |||
2016
| Party | Candidate | Votes | % | ±% | |
|---|---|---|---|---|---|
| Independent | 1. Rod Kendall (elected 1) 2. Tim Koschel (elected 5) 3. David Merlino 4. Donna Argus 5. Paul Watson 6. Leila Bright 7. Robyn Krik |
6,840 | 20.50 | ||
| Country Labor | 1. Dan Hayes (elected 2) 2. Vanessa Keenan (elected 8) 3. Leah Ellis 4. Bethany Saab 5. James Halliburton |
5,670 | 17.00 | ||
| Independent | 1. Kerry Pascoe (elected 3) 2. Michelle Bray 3. Belinda Coleman 4. Tim Sheather 5. Steven Wait |
4,540 | 13.61 | ||
| Independent | 1. Paul Funnell (elected 4) 2. Tina Gavel 3. Jack Egan 4. Mick Henderson 5. Denise Flack |
4,545 | 13.62 | ||
| Independent | 1. Yvonne Braid (elected 6) 2. Greg Packer 3. Simone Lieschke 4. Brett Grant 5. Myriam Hribar |
1,882 | 5.64 | ||
| Independent | Greg Conkey (elected 7) | 1,181 | 3.54 | ||
| Independent | Dallas Tout (elected 9) | 876 | 2.63 | ||
| Independent | 1. Andreia Schineanu 2. Atlanta Hall 3. Bianca Miller 4. Kerri-Anne Miller 5. Jenni Campbell |
1,653 | 4.96 | ||
| Greens | 1. Kevin Poynter 2. Jacquie Tinkler 3. Emma Rush 4. Michael Bayles 5. Ray Goodlass |
1,447 | 4.34 | ||
| Australia First | 1. Lorraine Sharp 2. Robbie Williams 3. Jean Williams 4. Chris Sharp 5. Jean Huges |
1,476 | 4.42 | ||
| Independent | Alan Brown | 584 | 1.75 | ||
| Independent | Mary Kidson | 546 | 1.64 | ||
| Independent | Simone Eyles | 413 | 1.24 | ||
| Independent | Richard Foley | 506 | 1.52 | ||
| Independent | Peter Dale | 435 | 1.30 | ||
| Independent | Anabel Williams | 395 | 1.18 | ||
| Independent | 1. Ros Prangnell 2. Patricia Murray |
223 | 0.67 | ||
| Independent | Peter Templeton | 147 | 0.44 | ||
| Total formal votes | 33,359 | 93.85 | |||
| Informal votes | 2,186 | 6.15 | |||
| Turnout | 35,545 | 80.54 | |||
Symbols and emblems
Crows are considered a symbol of the city of Wagga Wagga, appearing in the council's logo, coat of arms, and throughout local business logos and public artworks. This is due to the debated interpretation of 'Wagga Wagga' being derived from a Wiradjuri term meaning 'place of many crows'. The floral emblem for the city is the silver banksia.[36]
Coat of arms
 |
|
Gallery
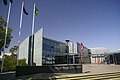 Wagga Wagga Civic Centre
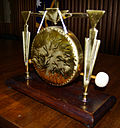 City Council Mayoral gong. Stolen 2 January 2009, remains unfound


See also
Notes
- The Australian Bureau of Statistics has stated that most who nominate "Australian" as their ancestry are part of the Anglo-Celtic group.
- Those who nominated their ancestry as "Australian Aboriginal". Does not include Torres Strait Islanders. This relates to nomination of ancestry and is distinct from persons who identify as Indigenous (Aboriginal or Torres Strait Islander) which is a separate question.


