Demographics of the Democratic Party (United States)
From Wikipedia, the free encyclopedia
The Democratic Party of the United States is composed of various demographic groups.
Ethnicity
In 2023, Pew found that 56% of Democrat voters were white, 18% Black and 16% Hispanic.[1]
African Americans
 Former President Barack Obama
 Former Vice President Kamala Harris
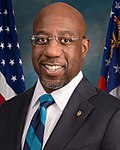 Senator Raphael Warnock


Originally, the Republican Party was favored by African Americans after the end of the civil war and emancipation of enslaved African Americans. This trend started to gradually change in the 1930s, with Franklin D. Roosevelt's New Deal programs that gave economic relief to all minorities including African Americans and Hispanics. Support for the civil rights movement in the 1960s by Democratic presidents John F. Kennedy and Lyndon B. Johnson helped give the Democrats even larger support among the Black community, although their position also alienated the Southern white population. Starting around this time, African Americans were alienated from the Republican Party by the Southern strategy, particularly by Richard Nixon.[2] Today, African Americans have stronger support for the Democratic Party than any group has for either party, voting 93% Democratic in the 2012 presidential election,[3] 89% Democratic in the 2016 presidential election,[4] and 87% Democratic in the 2020 presidential election.[5] Prominent Black American Democrats include President Barack Obama, Vice President Kamala Harris, former Supreme Court Justice Thurgood Marshall, Senators Raphael Warnock and Cory Booker, former Senator Carol Moseley Braun, former Governors Douglas Wilder and Deval Patrick, Representatives Shirley Chisholm, John Lewis, Elijah Cummings and Jim Clyburn, and Mayor Brandon Johnson.
Asian Americans
 Senator Tammy Duckworth
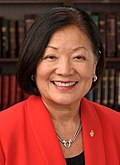
 Senator Mazie Hirono
 Senator Andy Kim
 Representative Mark Takano
 Representative Ro Khanna
.jpg)

.jpg)


The Democratic Party also has considerable support in the small yet growing Asian American population. The Asian American population had been a stronghold of the Republican Party until the United States presidential election of 1992 in which George H. W. Bush won 55% of the Asian American vote, compared to Bill Clinton winning 31% and Ross Perot winning 15%. Originally, the majority of Asian Americans consisted of strongly anti-communist Vietnamese refugees, Chinese Americans, Taiwanese Americans, Korean Americans, and Filipino Americans. The Republican Party's socially conservative, fervently anti-communist position strongly resonated with this original demographic. The Democratic Party made gains among the Asian American population starting in 1996 and in 2006 won 62% of the Asian American vote. Exit polls after the 2008 presidential election indicated that Democrat Barack Obama had won 62% of the Asian American vote.[6] In the 2012 presidential election, 73% of the Asian American electorate voted for Obama's reelection.[7]
According to a survey taken by the Times of India, Obama had the support of 85% of Indian Americans, 68% of Chinese Americans, and 57% of Filipino Americans in 2012.[8] The Asian American community's increasing number of young voters has also helped to erode traditionally Republican voting blocs such as Vietnamese Americans, making the community increasingly a Democratic stronghold. Prominent Asian American Democrats include Senators Mazie Hirono and Tammy Duckworth, former senators Daniel Inouye and Daniel Akaka, former Governor and Secretary of Commerce Gary Locke, and Representatives Judy Chu, Doris Matsui, and Andy Kim.
Hispanic and Latino Americans
 Senator Catherine Cortez Masto
 Senator Alex Padilla
 Representative Pete Aguilar
 Representative Alexandria Ocasio-Cortez


The Hispanic American population, particularly the large Mexican American population in the Southwest and the large Puerto Rican, Dominican, and Central American populations in the Northeast, have been strongholds for the Democratic Party. Hispanic Democrats commonly favor liberal views on immigration. In the 1996 presidential election, Democratic president Bill Clinton received 72% of the Hispanic vote.
After a period of incremental gains under George W. Bush, the Republican Party's support among Hispanics seriously eroded after a heated and acrimonious debate within the party during the 109th Congress over immigration reform. Nationwide protests helped galvanize Hispanic political participation, and in the 2006 elections, Democrats increased their share of the Hispanic vote to 69%.[9] This trend continued in 2008, as Barack Obama carried the Latino vote with 67%.[10] Obama expanded his share of the Latino vote to 71% in the 2012 presidential election.
Native Americans
 Former Secretary Deb Haaland
 Representative Sharice Davids


The Democratic Party also has strong support among certain tribes of the Native American population.[43] Though now a small percentage of the population (virtually non-existent in some regions), most Native American precincts vote Democratic in margins exceeded only by African Americans.[44]
Modern-day Democratic Native American politicians include former Congressman and former United States Under Secretary of the Army Brad Carson of Oklahoma, Lieutenant Governor Byron Mallott of Alaska, Principal Chief Bill John Baker of the Cherokee Nation, and Governor Bill Anoatubby of the Chickasaw Nation.
In 2018, Democrats Deb Haaland of New Mexico and Sharice Davids of Kansas became the first Native American women ever elected to Congress.[45] Democrat Peggy Flanagan was also elected in 2018 and currently serves as Lieutenant Governor of Minnesota. Flanagan is the second Native American woman to be elected to statewide executive office in U.S. history and the highest-ranking Native woman to be elected to executive office.[46]
Religion
Buddhist and Hindu Americans
 Senator Mazie Hirono
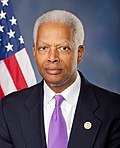 Representative Hank Johnson
 Representative Ro Khanna
 Representative Raja Krishnamoorthi
.jpg)

.jpg)

Both Buddhist and Hindu Americans tend to vote Democratic. In the 2008 presidential election, Buddhists supported Obama by 86% while Hindus backed Barack Obama by around 82%. In the 2012 presidential election, Obama again received 84% of the Buddhist vote while Hindus backed him by 82%. In the 2020 presidential election, majority of Buddhist voters (73%) chose Joe Biden for president. Similarly, most Hindu voters (77%) supported Biden.[47] As of 2022, both Buddhist and both Hindu members of Congress are Democrats.[48]
Christian Americans
 Former United States President Joe Biden (Roman Catholic)
 Former United States President Bill Clinton (Baptist)
 United States Senator Tom Carper (Presbyterian)
 United States Senator Debbie Stabenow (United Methodist Church)
 Former United States Representative Ben McAdams (The Church of Jesus Christ of Latter-day Saints)


.jpg)


As of 2021[update], every Democratic United States President, Democratic United States Vice President, and Democratic presidential nominee has been a Christian. According to the Pew Research Center, 78.4% of Democrats in the 116th United States Congress were Christian.[49]
However, the vast majority of white evangelical and Latter-day Saint Christians favor the Republican Party.[50]
Irreligious Americans

The Democratic Party receives support from secular organizations such as the Secular Coalition for America[51] and many agnostic and atheist Americans. Exit polls from the 2008 election showed that although a religious affiliation of "none" accounted for 12% of the electorate, they overwhelmingly voted for Obama by a 75–25% margin.[52] In his inaugural address, Obama acknowledged atheists by saying that the United States is not just "Christians and Muslims, Jews and Hindus but non-believers as well".[53] In the 2012 election cycle, Obama had moderate to high rankings with the Secular Coalition for America, whereas the majority of the Republican candidates had ratings in the low-to-failing range.[54]
A Pew Research Center survey conducted between January and June 2016 found 28% of Democratic and Democratic-leaning registered voters were religiously unaffiliated. A Pew Research Center survey conducted in June 2016 found that 67% of religious "nones" supported Hillary Clinton and 23% supported Donald Trump.[55]
An October 2012 American Values Survey found that among atheist and agnostic American voters, 51% identified as politically independent, 39% Democratic, 9% Republican, and 1% other. Moreover, 57% in this group identified as liberal, and 81% supported Barack Obama in the 2012 presidential election.[56]
| Year | Branch | % of Democratic vote among those who self identify their religion as "None" | |
|---|---|---|---|
| 1996[57] | United States Presidency | 59 | |
| 2000[58] | United States Presidency | 61 | |
| 2004[59] | United States House of Representatives | 65 | |
| 2004[30] | United States Presidency | 67 | |
| 2006[60] | United States House of Representatives | 74 | |
| 2008[61] | United States House of Representatives | 72 | |
| 2008[62] | United States Presidency | 75 | |
| 2012[63] | United States House of Representatives | 71 | |
| 2012[36] | United States Presidency | 70 | |
| 2014[64] | United States House of Representatives | 69 | |
| 2016[38] | United States Presidency | 68 | |
| 2016[39] | United States House of Representatives | 72 | |
| 2018[40] | United States House of Representatives | 70 | |
| 2020[41] | United States Presidency | 65 | |
| 2020[42] | United States House of Representatives | 66 | |
Jewish Americans

 Senator Jon Ossoff
 Senator Ron Wyden
 Representative Debbie Wasserman Schultz
 Representative Jerry Nadler
.jpg)

.jpg)

.jpg)
Jewish Americans are a stronghold for the Democratic Party, with more than 70% of Jewish voters having cast their ballots for the Democrats in the 1992 through 2016 presidential elections. Of the 29 Jewish Senators and Representatives who served in the 114th Congress, 27 were Democrats.[65] Among American Jews are people who consider themselves religious believers of one denomination or another as well as people who are explicitly or implicitly secular.
Muslim Americans
 Representative Ilhan Omar
 Representative Rashida Tlaib
 Representative André Carson
_A.jpg)

.jpg)

Muslims make up about 0.6% of Americans and in the 2008 presidential election, 89% of Muslim Americans voted for Barack Obama.[68] They also tend to be socially conservative, but the younger generation of Muslim Americans tends to be more socially liberal.[69]
After the September 11 attacks, many Muslim Americans experienced hostility and discrimination,[70] and many right-wing religious and political leaders attacked Islam both as a violent religion and as a threat to American values.[71][72] Furthermore, most Muslim Americans opposed the Iraq War, solidifying their shift to the Democratic Party.[73]
Islamic convert Keith Ellison was elected as the first Muslim member of Congress in 2006. He was elected as the U.S. representative for Minnesota's 5th congressional district. In 2018, Ellison was elected as the Attorney General of Minnesota.[74]
A 2017 Pew Research Center report found that majority (66%) of American Muslims identify with or learn toward the Democratic Party.[75]
According to exit polls for the 2018 midterm elections, 78% of Muslim voters supported Democratic candidates. 46% considered themselves liberal on social issues, while 35% considered themselves socially conservative. 40% considered themselves liberal on fiscal issues, while 43% considered themselves fiscally conservative.[76]
The majority of American Muslims that ran for political office in 2018 were Democrats.[77][78] The first two Muslim women to serve in Congress, Ilhan Omar and Rashida Tlaib, are both Democrats.
A 2021 survey conducted by YouGov/CCES showed that nearly 84% of Muslims voted for Biden in 2020.[47] Another survey conducted by Emgage/Muslim Public Affairs Council in 2021 similarly showed a majority of Muslim voters (86%) backing Biden in the 2020 election.[79]
Voters with higher education


The Democratic Party has steadily increased the percentage of votes it receives from voters with college degrees since the 1970s, while the educational attainment of the United States has steadily increased. Voters with college degrees as a whole were a Republican-voting group until the 1990s. Despite winning in a landslide 61-39% in 1964, Democratic president Lyndon B. Johnson only narrowly won a majority of voters with college degrees 52-48%.[80] In 1976, Democrat Jimmy Carter narrowly won while losing voters with college degrees 43-55%.[81]
A majority of voters with higher education, particularly those with a Bachelor's degree or higher, have tended to vote for the Democratic Party since the 1990s.[82][83]
Since the 1990s, a majority of voters with graduate degrees have consistently voted for the Democratic Party. Republican president George W. Bush won voters with just a bachelor's degree 52-46% and lost voters with a graduate degree 44-55%, while winning re-election in 2004.[84] Despite Obama's decisive 2008 victory, Republican nominee John McCain won a majority of white voters with college degrees 51-47%.[85] In 2012, Republican nominee Mitt Romney won white voters with college degrees 56-42%, though Obama won voters with college degrees as a whole 50-48% while winning re-election.[86]
Postgraduate education

.jpg)
Economic groups
Lower income families
Voters without college degrees

Voters without a college degree, also referred to as "working class" voters in many sources, continue to be a large part of the Democratic coalition. Economic insecurity inclines many voters without college degrees to have left-leaning views on economic issues. However, many Democratic voters without college degrees differ from liberals in their more socially conservative views. Democratic voters without college degrees are more likely to belong to an ethnic minority.[88]
Since 1980,[89] there has been a decline in support for the Democratic Party among white voters without college degrees.[90][91][92] In the 2008 presidential election, Barack Obama carried 40% of white voters without college degrees to John McCain carrying 58%.[93] In the 2012 presidential election, Obama carried 36% of white voters without college degrees to Mitt Romney carrying 61%.[94] In the 2020 presidential election, Biden carried 32% of white voters without college degrees to Donald Trump carrying 67%.[95]
Organized labor
.jpg)
.svg)
Since the 1930s, a critical component of the Democratic Party coalition has been organized labor. Labor unions supply a great deal of the money, grassroots political organization, and voting base of support for the party. Union membership in the United States has declined from an all-time high in 1954 of 35% to a low of 11% in 2015. After the 1968 Democratic National Convention, the McGovern–Fraser Commission set up the modern system of primaries. It also removed organized labor from its structural position of power in the Democratic Party and opened it up democratically to the voters.
| Year | Branch | % of Democratic vote among union members | |
|---|---|---|---|
| 2000[87] | United States Presidency | 62 | |
| 2004[59] | United States House of Representatives | 65 | |
| 2004[30] | United States Presidency | 61 | |
| 2006[60] | United States House of Representatives | 68 | |
| 2008[96] | United States House of Representatives | 65 | |
| 2008[97] | United States Presidency | 61 | |
| 2012[98] | United States Presidency | 58 | |
| 2020[41] | United States Presidency | 56 | |
| 2020[42] | United States House of Representatives | 60 | |
Gender demographics
Female voters
 Former Secretary Hillary Clinton
 Former House Speaker Nancy Pelosi
- Senator Tammy Duckworth
 Senator Amy Klobuchar
 Senator Lisa Blunt Rochester


.jpg)
.jpg)
LGBTQ+ voters
 Former Secretary Pete Buttigieg
 Senator Tammy Baldwin
 Representative Becca Balint
 Representative Mark Pocan


.jpg)

Since the 1970s, LGBTQ Americans have been a key constituency in the Democratic Party. In 1971, the Alice B. Toklas LGBT Democratic Club was formed as the first organization for LGBT Democrats in the nation. During the 1980 Democratic Party presidential primaries, Ted Kennedy alleged that President Jimmy Carter was not doing enough for LGBT rights. LGBT voters contributed to Kennedy's victory in California's primary.
Presidents Bill Clinton and Barack Obama both heavily targeted LGBT voters. Exit polling from 1990 to the present shows that LGBT voters overwhelmingly prefer the Democratic Party over the Republican Party.[99][100] In the 2012 election exit polls, Obama won 76% of LGBT voters. In the 2016 election exit polls, Hillary Clinton won 78% of LGBT voters. In the 2018 election exit polls, Democratic candidates for the House of Representatives won 82% of LGBT voters.
In January 2021, Oklahoma State Representative Mauree Turner became the first openly non-binary state legislator.
Transgender Americans

At the 2000 Democratic National Convention, Jane Fee of Minnesota was the first transgender delegate to a Democratic National Convention. The 2008 National Democratic Party platform for the first time included "gender identity" in the party platform, the first explicit inclusion of transgender people in the national Democratic Party platform. In 2009, the Democratic National Committee (DNC) added gender identity to the DNC's non-discrimination policy and DNC Chair Tim Kaine appointed Barbra Casbar Siperstein the first openly transgender member of the DNC. In 2010, President Obama became the first president to appoint an openly transgender person to political positions in the United States federal government. In 2012, Trans United for Obama, the first partisan transgender issues group was formed to reelect President Barack Obama.[101] During the 2015 State of the Union Address, President Obama became the first U.S. president ever to use the term "transgender".[102] At the 2016 Democratic National Convention, Sarah McBride became the first openly transgender person to address a Democratic National Convention.[103] A 2015 United States Transgender Survey found 50% of transgender Americans identified as Democrats and 48% as independents. When asked about their political views, 55% described themselves as very liberal, 27% liberal, 15% moderate, 2% conservative, and 1% very conservative.[104] Assistant Secretary for Health Rachel Levine was the first openly transgender person to hold an office that requires Senate confirmation.[105]
Other demographic data
Unmarried people
.jpg)
Younger voters
 Representative Sara Jacobs
 Representative Maxwell Frost
 Representative Jake Auchincloss


Ideological bases
Registered Democrats
_(cropped).jpg)
.jpg)