Fife Council elections
From Wikipedia, the free encyclopedia
Local government elections in Fife, Scotland
Fife Council in Scotland holds elections every five years, previously holding them every four years from its creation as a single-tier authority in 1995 to 2007.
As a regional council
| Year | SNP | Labour | Liberal[a] | Conservative | Communist | Independent |
|---|---|---|---|---|---|---|
| 1974 | 0 | 26 | 0 | 10 | 1 | 5[b] |
| 1978 | 1 | 24 | 0 | 14 | 1 | 2 |
| 1982[c] | 1 | 27 | 4 | 10 | 1 | 2 |
| 1986 | 2 | 30 | 8 | 4 | 1 | 1 |
| 1990 | 2 | 30 | 10 | 2 | 1 | 1 |
| 1994[d] | 4 | 28 | 12 | 0 | 1 | 1 |
As a unitary authority
| Year | SNP | Labour | Liberal Democrats | Conservative | Communist | Independent |
|---|---|---|---|---|---|---|
| 1995 | 9 | 52 | 24 | 0 | 1 | 2 |
| 1999[a] | 9 | 43 | 21 | 1 | 1 | 4[b] |
| 2003 | 11 | 36 | 23 | 2 | 0 | 6 |
| 2007[c] | 23 | 24 | 21 | 5 | 0 | 5 |
| 2012 | 26 | 35 | 10 | 3 | 0 | 4 |
| 2017[d] | 29 | 24 | 7 | 15 | 0 | 0 |
| 2022 | 34 | 20 | 13 | 8 | 0 | 0 |
Results maps
 1982 results map
 1986 results map
 1990 results map
 1994 results map
 1995 results map
 1999 results map
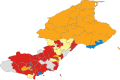 2003 results map
 2007 results map
 2012 results map
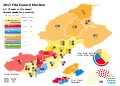 2017 results map
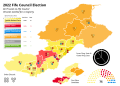 2022 results map


By-elections
2003-2007
| Party | Candidate | Votes | % | ±% | |
|---|---|---|---|---|---|
| Labour | 462 | 38.2 | −8.0 | ||
| SNP | 319 | 26.3 | +26.3 | ||
| Independent | 297 | 24.5 | +24.5 | ||
| Scottish Socialist | 72 | 5.9 | −1.7 | ||
| Liberal Democrats | 24 | 2.0 | −0.5 | ||
| Conservative | 19 | 1.6 | −1.2 | ||
| Scottish Senior Citizens | 18 | 1.5 | +1.5 | ||
| Majority | 143 | 11.8 | |||
| Turnout | 1,211 | ||||
| Labour hold | Swing | ||||
| Party | Candidate | Votes | % | ±% | |
|---|---|---|---|---|---|
| Liberal Democrats | 443 | 34.4 | −20.7 | ||
| Independent | 379 | 29.4 | +29.4 | ||
| Conservative | 342 | 26.5 | +1.2 | ||
| SNP | 54 | 4.2 | +4.2 | ||
| Scottish Socialist | 40 | 3.1 | −5.2 | ||
| Labour | 31 | 2.4 | −8.9 | ||
| Majority | 64 | 5.0 | |||
| Turnout | 1,289 | ||||
| Liberal Democrats hold | Swing | ||||
| Party | Candidate | Votes | % | ±% | |
|---|---|---|---|---|---|
| SNP | 609 | 46.7 | +21.9 | ||
| Labour | 321 | 24.6 | −4.1 | ||
| Independent | 249 | 19.1 | +19.1 | ||
| Liberal Democrats | 71 | 5.4 | −11.3 | ||
| Conservative | 54 | 4.1 | +4.1 | ||
| Majority | 288 | 22.1 | |||
| Turnout | 1,304 | ||||
| SNP gain from Independent | Swing | ||||
| Party | Candidate | Votes | % | ±% | |
|---|---|---|---|---|---|
| SNP | John Beare[9] | 892 | 55.7 | +26.1 | |
| Labour | 388 | 24.2 | −34.0 | ||
| Liberal Democrats | 257 | 16.1 | +10.5 | ||
| Conservative | 39 | 2.4 | −4.2 | ||
| Independent | 25 | 1.6 | +1.6 | ||
| Majority | 504 | 31.5 | |||
| Turnout | 1,601 | ||||
| SNP gain from Labour | Swing | ||||
2012-2017
| Party | Candidate | FPv% | Count | ||||
|---|---|---|---|---|---|---|---|
| 1 | 2 | 3 | 4 | ||||
| Labour | John Wincott | 45.8 | 1,896 | 1,927 | 1,966 | 2,095 | |
| SNP | Keith Grieve | 41.3 | 1,711 | 1,724 | 1,761 | 1,814 | |
| Conservative | Allan Smith | 6.6 | 272 | 287 | 335 | ||
| UKIP | Peter Taggerty | 4.3 | 176 | 184 | |||
| Liberal Democrats | Harry Wills | 2.0 | 83 | ||||
| Labour hold | |||||||
| Valid: 4,138 Spoilt: 25 Quota: 2,070 Turnout: 4,163 | |||||||
| Party | Candidate | FPv% | Count | ||||||
|---|---|---|---|---|---|---|---|---|---|
| 1 | 2 | 3 | 4 | 5 | 6 | ||||
| Labour | Billy Pollock | 39.7 | 2,552 | 2,568 | 2,618 | 2,697 | 3,170 | 4,086 | |
| SNP | Helen Cannon-Todd | 32.0 | 2,057 | 2,075 | 2,112 | 2,142 | 2,358 | ||
| Liberal Democrats | Robin Munro | 15.7 | 1,009 | 1,029 | 1,073 | 1,257 | |||
| Conservative | David Ross | 7.0 | 450 | 497 | 504 | ||||
| Green | Angela Dixon | 2.8 | 183 | 201 | |||||
| UKIP | Judith Rideout | 2.8 | 183 | ||||||
| Labour hold | |||||||||
| Valid: 6,434 Quota: 3,217 | |||||||||
| Party | Candidate | FPv% | Count | |
|---|---|---|---|---|
| 1 | ||||
| Labour | Gary Guichan | 61.5 | 2,039 | |
| SNP | Connor Watt | 25.2 | 834 | |
| UKIP | Judith Rideout | 8.4 | 277 | |
| Conservative | John Wheatley | 4.9 | 164 | |
| Labour hold | ||||
| Valid: 3,314 | ||||
| Party | Candidate | FPv% | Count | |
|---|---|---|---|---|
| 1 | ||||
| Labour | Alex Campbell | 65.9 | 2,042 | |
| SNP | Lesley Backhouse | 24.3 | 753 | |
| UKIP | Martin Green | 5.2 | 162 | |
| Conservative | Jonathan Gray | 4.6 | 141 | |
| Labour hold | ||||
| Valid: 3,098 Spoilt: 52 Quota: 1,550 Turnout: 3,150 | ||||
| Party | Candidate | FPv% | Count | ||||||
|---|---|---|---|---|---|---|---|---|---|
| 1 | 2 | 3 | 4 | 5 | 6 | ||||
| SNP | Marie Penman | 47.3 | 1,460 | 1,464 | 1,466 | 1,472 | 1,484 | 1,553 | |
| Labour | Liz Easton | 35.3 | 1,088 | 1,088 | 1,091 | 1,097 | 1,120 | 1,148 | |
| Conservative | Edgar Cook | 7.2 | 223 | 224 | 225 | 231 | 266 | 274 | |
| Green | Claire Reid | 4.1 | 126 | 129 | 132 | 138 | 150 | ||
| UKIP | Peter Adams | 3.8 | 117 | 117 | 120 | 123 | |||
| Liberal Democrats | Callum Leslie | 1.3 | 40 | 40 | 41 | ||||
| Independent | Ronald Hunter | 0.6 | 19 | 21 | |||||
| Independent | Alastair MacIntyre | 0.4 | 12 | ||||||
| SNP hold | |||||||||
| Valid: 3,085 Spoilt: 41 Quota: 1,543 Turnout: 3,126 | |||||||||
| Party | Candidate | FPv% | Count | |
|---|---|---|---|---|
| 1 | ||||
| SNP | Craig Walker | 55.3 | 2,539 | |
| Labour | Alan Seath | 35.8 | 1,643 | |
| Conservative | John Wheatley | 4.4 | 202 | |
| UKIP | Martin Green | 3.2 | 146 | |
| Liberal Democrats | Jane Ann Liston | 1.3 | 61 | |
| SNP gain from Labour | ||||
| Valid: 4,591 | ||||
| Party | Candidate | FPv% | Count | |
|---|---|---|---|---|
| 1 | ||||
| SNP | Fay Sinclair | 51.5 | 5,899 | |
| Labour | Andrew Verrecchia | 27.8 | 3,185 | |
| Conservative | David Ross | 11.6 | 1,324 | |
| Liberal Democrats | James Calder | 9.1 | 1,041 | |
| SNP gain from Labour | ||||
| Valid: 11,449 Spoilt: 132 Quota: 5,725 Turnout: 11,581 | ||||
| Party | Candidate | FPv% | Count | |
|---|---|---|---|---|
| 1 | ||||
| SNP | Julie Ford | 59.0 | 2,235 | |
| Labour | Alan Seath | 31.9 | 1,207 | |
| Conservative | Jonathan Gray | 6.2 | 234 | |
| Green | Lorna Ross | 3.0 | 113 | |
| SNP hold | ||||
| Valid: 3,789 Quota: 1,895 | ||||
| Party | Candidate | FPv% | Count | ||||||
|---|---|---|---|---|---|---|---|---|---|
| 1 | 2 | 3 | 4 | 5 | 6 | ||||
| SNP | Ian Ferguson | 43.5 | 1,056 | 1,062 | 1,083 | 1,122 | 1,144 | 1,337 | |
| Labour | Joe Long | 29.6 | 719 | 722 | 733 | 805 | 912 | ||
| Conservative | James Reekie | 12.5 | 304 | 319 | 321 | 389 | |||
| Liberal Democrats | James Calder | 9.5 | 230 | 235 | 253 | ||||
| Green | Lewis Campbell | 2.6 | 63 | 72 | |||||
| UKIP | Chloanne Dodds | 2.4 | 58 | ||||||
| SNP hold | |||||||||
| Valid: 2,430 Spoilt: 20 Quota: 1,216 Turnout: 2,450 | |||||||||
| Party | Candidate | FPv% | Count | |||||||
|---|---|---|---|---|---|---|---|---|---|---|
| 1 | 2 | 3 | 4 | 5 | 6 | 7 | ||||
| SNP | Sharon Wilson | 45.2 | 1,214 | 1,235 | 1,241 | 1,249 | 1,263 | 1,286 | 1,623 | |
| Labour | Vikki Fairweather | 34.5 | 926 | 939 | 950 | 966 | 1,012 | 1,117 | ||
| Conservative | David Ross | 9.1 | 245 | 246 | 256 | 281 | 309 | |||
| Liberal Democrats | Matthew Hall | 3.6 | 97 | 102 | 112 | 122 | ||||
| UKIP | Colin Mitchelson | 3.3 | 88 | 90 | 97 | |||||
| Independent | Alastair MacIntyre | 2.5 | 66 | 68 | ||||||
| Green | Cairinne MacDonald | 1.9 | 51 | |||||||
| SNP hold | ||||||||||
| Valid: 2,687 Spoilt: 22 Quota: 1,344 Turnout: 2,709 | ||||||||||
| Party | Candidate | FPv% | Count | ||||
|---|---|---|---|---|---|---|---|
| 1 | 2 | 3 | 4 | ||||
| Labour | Mary Bain Lockhart | 47.1 | 1,318 | 1,329 | 1,365 | 1,459 | |
| SNP | Lea McLelland | 38.6 | 1,079 | 1,091 | 1,106 | 1,124 | |
| Conservative | Malcolm McDonald | 9.6 | 270 | 275 | 280 | ||
| Communist | Thomas Kirby | 3.1 | 86 | 89 | |||
| Green | Bradford Oliver | 1.6 | 45 | ||||
| Labour gain from Independent | |||||||
| Valid: 2,798 Quota: 1,400 | |||||||
| Party | Candidate | FPv% | Count | |||||
|---|---|---|---|---|---|---|---|---|
| 1 | 2 | 3 | 4 | 5 | ||||
| SNP | Alistair Suttie | 37.0 | 1,501 | 1,532 | 1,615 | 1,668 | 2,214 | |
| Labour | Colin Davidson | 28.4 | 1,155 | 1,169 | 1,302 | 1,620 | ||
| Conservative | Graham Ritchie | 18.5 | 752 | 754 | 954 | |||
| Liberal Democrats | Steve Wood | 14.3 | 580 | 590 | ||||
| Green | Iain Morrice | 1.8 | 74 | |||||
| SNP hold | ||||||||
| Valid: 4,062 Spoilt: 28 Quota: 2,032 Turnout: 4,090 | ||||||||
2017-2022
| Party | Candidate | FPv% | Count | ||||||||
|---|---|---|---|---|---|---|---|---|---|---|---|
| 1 | 2 | 3 | 4 | 5 | 6 | 7 | 8 | ||||
| Conservative | Dave Coleman | 37.3 | 2,309 | 2,312 | 2,316 | 2,330 | 2,455 | 2,615 | 2,839 | 3,244 | |
| SNP | Neale Hanvey | 28.1 | 1,741 | 1,741 | 1,744 | 1,840 | 1,950 | 2,076 | 2,327 | ||
| Labour | Billy Pollock | 12.0 | 744 | 746 | 747 | 794 | 867 | 1,058 | |||
| Liberal Democrats | Callum Hawthorne | 9.1 | 566 | 568 | 573 | 631 | 738 | ||||
| Independent | Peter Collins | 8.4 | 521 | 524 | 545 | 565 | |||||
| Green | Mags Hall | 4.2 | 257 | 257 | 258 | ||||||
| Independent | Alastair MacIntyre | 0.6 | 40 | 41 | |||||||
| Scottish Libertarian | Calum Paul | 0.2 | 13 | ||||||||
| Conservative gain from Labour | |||||||||||
| Valid: 6,191 Spoilt: 48 Quota: 3,096 Turnout: 6,239 | |||||||||||
| Party | Candidate | FPv% | Count | ||||||
|---|---|---|---|---|---|---|---|---|---|
| 1 | 2 | 3 | 4 | 5 | 6 | ||||
| SNP | Derek Glen | 33.2 | 1,526 | 1,528 | 1,628 | 1,761 | 1,798 | 2,297 | |
| Liberal Democrats | Aude Boubaker-Calder | 22.8 | 1,050 | 1,053 | 1,117 | 1,343 | 1,796 | ||
| Conservative | Chloe Dodds | 24.8 | 1,142 | 1,150 | 1,150 | 1,202 | |||
| Labour | Michael Boyd | 13.5 | 621 | 624 | 656 | ||||
| Green | Fiona McOwan | 5.1 | 235 | 237 | |||||
| Scottish Libertarian | Keith Chamberlain | 0.6 | 28 | ||||||
| SNP gain from Conservative | |||||||||
| Valid: 4,602 Quota: 2,302 | |||||||||
| Party | Candidate | FPv% | Count | ||||||
|---|---|---|---|---|---|---|---|---|---|
| 1 | 2 | 3 | 4 | 5 | 6 | ||||
| SNP | Sharon Green-Wilson | 42.8 | 1,347 | 1,347 | 1,406 | 1,429 | 1,486 | 1,639 | |
| Conservative | Margaret Fairgrieve | 24.4 | 768 | 771 | 774 | 822 | 885 | 976 | |
| Labour | Billy Pollock | 15.2 | 480 | 480 | 498 | 526 | 591 | ||
| Liberal Democrats | Jill Blair | 7.9 | 249 | 250 | 275 | 291 | |||
| Independent | Alastair MacIntyre | 5.0 | 157 | 162 | 168 | ||||
| Green | Craig McCutcheon | 4.2 | 132 | 133 | |||||
| Scottish Libertarian | Calum Paul | 0.5 | 16 | ||||||
| SNP hold | |||||||||
| Valid: 3,149 Quota: 1,575 | |||||||||
2022-2027
| Party | Candidate | FPv% | Count | |||||||
|---|---|---|---|---|---|---|---|---|---|---|
| 1 | 2 | 3 | 4 | 5 | 6 | 7 | ||||
| Labour | Karen Beaton | 33.1 | 881 | 882 | 890 | 921 | 1,010 | 1,147 | 1,474 | |
| SNP | Paul Steele | 33.1 | 879 | 887 | 896 | 944 | 985 | 1,015 | ||
| Conservative | David Ross | 16.0 | 426 | 434 | 444 | 449 | 516 | |||
| Liberal Democrats | Paul Buchanan-Quigley | 8.5 | 227 | 232 | 246 | 279 | ||||
| Green | Fiona McOwan | 4.8 | 128 | 130 | 141 | |||||
| Independent | George Morton | 2.4 | 64 | 77 | ||||||
| Scottish Family | Danny Smith | 1.9 | 53 | |||||||
| Labour hold | ||||||||||
| Valid: 2,658 Spoilt: 26 Quota: 1,330 Turnout: 2,684 | ||||||||||
| Party | Candidate | FPv% | Count | ||||
|---|---|---|---|---|---|---|---|
| 1 | 2 | 3 | 4 | ||||
| SNP | Lynda Holton | 47.6 | 1,439 | 1,451 | 1,489 | 1,623 | |
| Labour | Maciej Dokurno | 21.5 | 649 | 674 | 753 | 878 | |
| Reform | Ian Smith | 17.9 | 541 | 591 | 652 | ||
| Liberal Democrats | Ed Scotcher | 6.9 | 207 | 257 | |||
| Conservative | Fiona Leslie | 6.1 | 185 | ||||
| SNP hold | |||||||
| Valid: 3,021 Spoilt: 63 Quota: 1,511 Turnout: 3,084 | |||||||
| Party | Candidate | FPv% | Count | ||||||
|---|---|---|---|---|---|---|---|---|---|
| 1 | 2 | 3 | 4 | 5 | 6 | ||||
| SNP | Anne Marie Caldwell | 42.6 | 1,594 | 1,604 | 1,608 | 1,646 | 1,674 | 1,900 | |
| Reform | Mark Davies | 28.9 | 1,080 | 1,088 | 1,102 | 1,113 | 1,126 | 1,220 | |
| Labour | Donna Donnelly | 20.8 | 778 | 779 | 783 | 793 | 826 | ||
| Liberal Democrats | Jill Reilly | 2.6 | 99 | 103 | 112 | 119 | |||
| Alba | Christine Watson | 2.2 | 83 | 90 | 92 | ||||
| Conservative | Brian Mills | 1.7 | 64 | 64 | |||||
| Sovereignty | Kieran Anderson | 1.2 | 45 | ||||||
| SNP gain from Labour | |||||||||
| Valid: 3,743 Spoilt: 31 Quota: 1,872 Turnout: 3,774 | |||||||||
| Party | Candidate | FPv% | Count | |||||
|---|---|---|---|---|---|---|---|---|
| 1 | 2 | 3 | 4 | 5 | ||||
| SNP | Zoe Hisbent | 44.3 | 1,167 | 1,171 | 1,201 | 1,225 | 1,382 | |
| Reform | Romeo Valente | 27.5 | 725 | 730 | 741 | 787 | 834 | |
| Labour | Jacob Winton | 15.7 | 413 | 417 | 452 | 496 | ||
| Conservative | Andrew Butchart | 6.9 | 182 | 183 | 202 | |||
| Liberal Democrats | Ed Scotcher | 4.7 | 125 | 129 | ||||
| Scottish Family | Danny Smith | 0.9 | 25 | |||||
| SNP hold | ||||||||
| Valid: 2,637 Spoilt: 26 Quota: 1,319 Turnout: 2,663 | ||||||||
References
- ↑ "Initial Statutory Reviews of Electoral Arrangements". National Records of Scotland. Retrieved 20 February 2025.
- ↑ "Second Statutory Reviews of Electoral Arrangements". National Records of Scotland. Retrieved 22 February 2025.
- ↑ "Third Statutory Review of Electoral Arrangements - Fife Council Area" (PDF). Local Government Boundary Commission for Scotland. Retrieved 22 February 2025.
- ↑ "Fifth Statutory Review of Electoral Arrangements Final Recommendations - Fife Council Area" (PDF). Local Government Boundary Commission for Scotland. Retrieved 20 February 2025.
- ↑ "Local Elections Archive Project — Lumphinnans and Lochgelly South Ward". www.andrewteale.me.uk. Retrieved 22 February 2025.
- ↑ "Local Elections Archive Project — Cupar North Ward". www.andrewteale.me.uk. Retrieved 22 February 2025.
- ↑ "Local Elections Archive Project — Auchtertool and Burntisland East Ward". www.andrewteale.me.uk. Retrieved 22 February 2025.
- ↑ "Local Elections Archive Project — Markinch and Woodside East Ward". www.andrewteale.me.uk. Retrieved 22 February 2025.
- ↑ "Labour loses Scottish council seat". The Guardian. 29 September 2006. Retrieved 22 February 2025.
- ↑ "Glenrothes North, Leslie and Markinch, 2013". Scottish Elections. Archived from the original on 5 August 2014. Retrieved 22 February 2025.
- ↑ "Dunfermline South, 2013". Scottish Elections. Archived from the original on 5 August 2014. Retrieved 5 May 2017.
- ↑ "Local Elections Archive Project — Cowdenbeath Ward". www.andrewteale.me.uk. Retrieved 22 February 2025.
- ↑ "Local Elections Archive Project — The Lochs Ward". www.andrewteale.me.uk. Retrieved 22 February 2025.
- ↑ "Kirkcaldy East by-election, 2015". Scottish Elections. Archived from the original on 26 January 2015. Retrieved 5 May 2017.
- ↑ "Local Elections Archive Project — Glenrothes West and Kinglassie Ward". www.andrewteale.me.uk. Retrieved 22 February 2025.
- ↑ "Local Elections Archive Project — Dunfermline South Ward". www.andrewteale.me.uk. Retrieved 22 February 2025.
- ↑ "Local Elections Archive Project — Glenrothes West and Kinglassie Ward". www.andrewteale.me.uk. Retrieved 22 February 2025.
- ↑ "Local Elections Archive Project — Dunfermline North Ward". www.andrewteale.me.uk. Retrieved 22 February 2025.
- ↑ "Local Elections Archive Project — Rosyth Ward". www.andrewteale.me.uk. Retrieved 22 February 2025.
- ↑ "The Lochs by-election, 2016". Scottish Elections. Archived from the original on 31 August 2016. Retrieved 5 May 2017.
- ↑ "Local Elections Archive Project — Leven, Kennoway and Largo Ward". www.andrewteale.me.uk. Retrieved 22 February 2025.
- ↑ "Inverkeithing and Dalgety Bay By-Election Result". Ballot Box Scotland. Retrieved 22 February 2025.
- 1 2 "Fife and Inverness Council By-Election Results, 14/11/19". Ballot Box Scotland. Retrieved 22 February 2025.
- ↑ "Ward 1 - West Fife and Coastal Villages" (PDF). Fife Council. Retrieved 23 February 2025.
- ↑ "By-Election Result: Glenrothes Central and Thornton". Ballot Box Scotland. 28 April 2025. Retrieved 9 November 2025.
- ↑ "Ward 22 - Buckhaven Methil and Wemyss Villages" (PDF). Fife Council. Retrieved 13 November 2025.
- ↑ "Ward 13 - Glenrothes West and Kinglassie" (PDF). Fife Council. Retrieved 30 January 2026.