Gedling Borough Council elections
Local government elections in Nottinghamshire, England
From Wikipedia, the free encyclopedia
Gedling Borough Council elections are held every four years. Gedling Borough Council is the local authority for the non-metropolitan district of Gedling in Nottinghamshire, England. Since the last boundary changes in 2015, 41 councillors have been elected from 19 wards.[1]
Council elections
- 1973 Gedling Borough Council election
- 1976 Gedling Borough Council election (New ward boundaries)[2]
- 1979 Gedling Borough Council election
- 1983 Gedling Borough Council election
- 1987 Gedling Borough Council election (Some new ward boundaries & borough boundary changes also took place)[3]
- 1991 Gedling Borough Council election (Borough boundary changes took place but the number of seats remained the same)[4]
- 1995 Gedling Borough Council election
- 1999 Gedling Borough Council election
- 2003 Gedling Borough Council election (New ward boundaries reduced the number of seats by 7)[5][6]
- 2007 Gedling Borough Council election
- 2011 Gedling Borough Council election
- 2015 Gedling Borough Council election (New ward boundaries reduced the number of seats from 50 to 41)[1]
- 2019 Gedling Borough Council election
- 2023 Gedling Borough Council election
Borough result maps
 2003 results map
 2007 results map
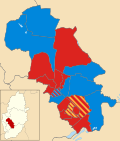 2011 results map
 2015 results map
 2019 results map
 2023 results map


By-elections
1995-1999
| Party | Candidate | Votes | % | ±% | |
|---|---|---|---|---|---|
| Conservative | 1,146 | 58.1 | |||
| Labour | 656 | 33.3 | |||
| Liberal Democrats | 169 | 8.6 | |||
| Majority | 490 | 24.9 | |||
| Turnout | 1,971 | 41.2 | |||
| Conservative hold | Swing | ||||
2011-2015
| Party | Candidate | Votes | % | ±% | |
|---|---|---|---|---|---|
| Liberal Democrats | Andrew Ellwood | 566 | 49.0 | +1.2 | |
| Labour | Allan Leadbeater | 445 | 38.5 | −13.7 | |
| Conservative | James Faulconbridge | 98 | 8.5 | N/A | |
| UKIP | Lee Waters | 46 | 4.0 | N/A | |
| Majority | 121 | 10.5 | |||
| Turnout | 1,155 | 30.8 | |||
| Liberal Democrats gain from Labour | Swing | ||||
| Party | Candidate | Votes | % | ±% | |
|---|---|---|---|---|---|
| Labour | David Ellis | 547 | 36.3 | −1.2 | |
| Conservative | Michael Adams | 483 | 32.0 | −8.6 | |
| UKIP | Lee Waters | 397 | 26.3 | +26.3 | |
| Liberal Democrats | Rhiann Stansfield-Coyne | 80 | 5.3 | −1.6 | |
| Majority | 64 | 4.3 | |||
| Turnout | 1,507 | 39.5 | |||
| Labour hold | Swing | ||||
| Party | Candidate | Votes | % | ±% | |
|---|---|---|---|---|---|
| Labour | Lynda Pearson | 482 | 32.6 | ||
| Liberal Democrats | Margaret Susan Dunkin | 428 | 28.9 | ||
| UKIP | Claude-Francois Loi | 337 | 22.8 | ||
| Conservative | James Faulconbridge | 233 | 15.7 | ||
| Majority | 54 | 3.6 | |||
| Turnout | 1,488 | 39.5 | |||
| Labour gain from Liberal Democrats | Swing | ||||
2019-2023
| Party | Candidate | Votes | % | ±% | |
|---|---|---|---|---|---|
| Liberal Democrats | Andrew Dunkin | 344 | 35.1 | +15.4 | |
| Labour | John Butterworth | 303 | 30.9 | −24.6 | |
| Conservative | Darren Maltby | 250 | 25.5 | +0.8 | |
| Independent | Fran Loi | 56 | 5.7 | +5.7 | |
| Green | Joe Norris | 26 | 2.7 | +2.7 | |
| Majority | 41 | 4.2 | |||
| Turnout | 979 | 23.2 | |||
| Liberal Democrats gain from Labour | Swing | ||||
| Party | Candidate | Votes | % | ±% | |
|---|---|---|---|---|---|
| Labour | Lynda Pearson | 693 | 39.4 | −14.4 | |
| Conservative | Charlie Godwin | 544 | 30.9 | +4.7 | |
| Liberal Democrats | Maggie Dunkin | 428 | 24.3 | +4.4 | |
| Green | Paul Sergent | 95 | 5.4 | +5.4 | |
| Majority | 149 | 8.5 | |||
| Turnout | 1,760 | ||||
| Labour hold | Swing | ||||
2023-2027
| Party | Candidate | Votes | % | ±% | |
|---|---|---|---|---|---|
| Conservative | Darren Maltby | 358 | 47.8 | ||
| Labour | John Taylor | 300 | 40.1 | ||
| Liberal Democrats | Patrick Shannon | 91 | 12.1 | ||
| Majority | 58 | 7.7 | |||
| Turnout | 749 | ||||
| Conservative gain from Labour | Swing | ||||
| Party | Candidate | Votes | % | ±% | |
|---|---|---|---|---|---|
| Labour | Pauline Allan | 1,066 | 43.9 | ||
| Reform | John Semens | 621 | 25.6 | ||
| Conservative | Mark Dillon | 363 | 14.9 | ||
| Green | Richard Sutton | 244 | 10.0 | ||
| Liberal Democrats | Robert Swift | 136 | 5.6 | ||
| Majority | 445 | 18.3 | |||
| Turnout | 2,430 | ||||
| Labour hold | Swing | ||||
| Party | Candidate | Votes | % | ±% | |
|---|---|---|---|---|---|
| Independent | Andy Meads | 1,245 | 66.3 | ||
| Reform | Keith Walters | 337 | 17.9 | ||
| Labour | Aimee Kimpton | 150 | 8.0 | ||
| Conservative | Izzy Corbally | 117 | 6.2 | ||
| Green | Oscar Power | 21 | 1.1 | ||
| Liberal Democrats | Andrew Davies | 8 | 0.4 | ||
| Majority | 908 | 48.3 | |||
| Turnout | 1,878 | ||||
| Independent gain from Conservative | Swing | ||||