Lancashire County Council elections
Local government elections in Lancashire, England
From Wikipedia, the free encyclopedia
Lancashire County Council elections are held every four years. Lancashire County Council is the upper-tier authority for the non-metropolitan county of Lancashire in England. Since the last boundary changes in 2017, 84 councillors have been elected from 82 electoral divisions.[1]
Election results
_Lancashire_County_Council_Election_Results_1973_-_2025.png)
Council composition
The composition of the council immediately following election, and excluding any subsequent by-election changes, has been:
| Overall control | Cons. | Labour | Reform UK | Lib Dems [n 1] | Green | UKIP | BNP | Idle Toad | Independents/Other | ||||||||||
| 2025 | Reform | 8 | 5 | 53 | 5 | 4 | 0 | 0 | - | 9 [n 2] | |||||||||
| 2021[2] | Conservative | 48 | 32 | - | 2 | 2 | 0 | - | - | 0 | |||||||||
| 2017[3] | Conservative | 46 | 30 | - | 4 | 1 | 1 | 0 | - | 2 [n 3] | |||||||||
| 2013[4] | NOC | 35 | 39 | - | 6 | 1 | 0 | 0 | 0 | 3 [n 4] | |||||||||
| 2009[5] | Conservative | 51 | 16 | - | 10 | 2 | 0 | 1 | 1 | 3 [n 5] | |||||||||
| 2005[6] | Labour | 31 | 44 | - | 6 | 1 | 0 | 0 | 1 | 1 [n 6] | |||||||||
| 2001[7][8] | Labour | 26 | 44 | - | 6 | 1 | - | - | - | 1 [n 7] | |||||||||
| 1997[9] | Labour | 23 | 47 | - | 7 | 0 | - | - | - | 1 [n 8] | |||||||||
| 1993 | Labour | 35 | 54 | - | 10 | 0 | - | - | - | 0 | |||||||||
| 1989 | Labour | 42 | 50 | - | 4 | 0 | - | - | - | 3 [n 9] | |||||||||
| 1985 | Labour | 42 | 48 | - | 9 | - | - | - | - | 0 | |||||||||
| 1981 | Labour | 38 | 53 | - | 6 | - | - | - | - | 2 [n 10] | |||||||||
| 1977 | Conservative | 83 | 12 | - | 1 | - | - | - | - | 0 | |||||||||
| 1973 | Conservative | 52 | 33 | - | 7 | - | - | - | - | 4 [n 11] | |||||||||
Visual representation
1973
1977
1981
1985
1989
1993
1997
2001
2005
2009
2013
2017
2021
2025
Council elections
- 1973 Lancashire County Council election
- 1977 Lancashire County Council election
- 1981 Lancashire County Council election (new division boundaries)[10]
- 1985 Lancashire County Council election
- 1989 Lancashire County Council election
- 1993 Lancashire County Council election
- 1997 Lancashire County Council election
- 2001 Lancashire County Council election
- 2005 Lancashire County Council election (new division boundaries)[11]
- 2009 Lancashire County Council election
- 2013 Lancashire County Council election
- 2017 Lancashire County Council election (new division boundaries)[1]
- 2021 Lancashire County Council election
- 2025 Lancashire County Council election
County result maps
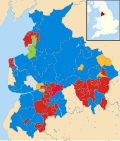 2005 results map
 2009 results map
 2013 results map
 2017 results map
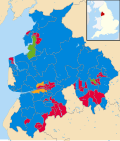 2021 results map
 2025 results map


By-election results
Elections in the 1990s
| Party | Candidate | Votes | % | ±% | |
|---|---|---|---|---|---|
| Labour | 751 | 38.5 | −11.2 | ||
| Conservative | 636 | 32.6 | −2.2 | ||
| Liberal Democrats | 565 | 28.9 | +13.4 | ||
| Majority | 115 | 5.9 | |||
| Turnout | 1,952 | 17.9 | |||
| Labour hold | Swing | ||||
| Party | Candidate | Votes | % | ±% | |
|---|---|---|---|---|---|
| Labour | 1,358 | 48.6 | −5.8 | ||
| Liberal Democrats | 1,296 | 46.3 | +14.7 | ||
| Conservative | 143 | 5.1 | −8.8 | ||
| Majority | 62 | 2.3 | |||
| Turnout | 2,797 | 29.0 | |||
| Labour hold | Swing | ||||
Elections in the 2000s
| Party | Candidate | Votes | % | ±% | |
|---|---|---|---|---|---|
| Liberal Democrats | 1,721 | 48.5 | −4.8 | ||
| Labour | 1,198 | 33.8 | +3.2 | ||
| Conservative | 627 | 17.7 | +2.1 | ||
| Majority | 523 | 14.7 | |||
| Turnout | 3,546 | 32.0 | |||
| Liberal Democrats hold | Swing | ||||
| Party | Candidate | Votes | % | ±% | |
|---|---|---|---|---|---|
| Conservative | 2,242 | 70.6 | +9.2 | ||
| Labour | 933 | 29.4 | −6.8 | ||
| Majority | 1,309 | 41.2 | |||
| Turnout | 3,175 | 30.4 | |||
| Conservative hold | Swing | ||||
| Party | Candidate | Votes | % | ±% | |
|---|---|---|---|---|---|
| Liberal Democrats | Anthony Pimblett | 1,518 | 48.8 | +13.7 | |
| Conservative | P Wakeling | 1,232 | 39.6 | +4.7 | |
| Labour | D Lyon | 358 | 11.5 | −18.4 | |
| Majority | 286 | 9.2 | |||
| Turnout | 3,108 | ||||
| Liberal Democrats hold | Swing | ||||
| Party | Candidate | Votes | % | ±% | |
|---|---|---|---|---|---|
| Conservative | William Parkinson | 1,781 | 49.8 | +20.1 | |
| Liberal Democrats | Howard Henshaw | 1,205 | 33.7 | −14.8 | |
| Labour | Jean Al-Serraj | 590 | 16.5 | −5.2 | |
| Majority | 576 | 16.1 | |||
| Turnout | 3,576 | 28.2 | |||
| Conservative gain from Liberal Democrats | Swing | ||||
| Party | Candidate | Votes | % | ±% | |
|---|---|---|---|---|---|
| Conservative | Jim Lawrenson | 1,536 | 48.3 | +7.7 | |
| Labour | Wayne Martin | 934 | 29.4 | −6.1 | |
| UKIP | Olive Bergin | 489 | 15.4 | +9.5 | |
| Liberal Democrats | Philip Pitman | 220 | 6.9 | −11.1 | |
| Majority | 602 | 18.9 | |||
| Turnout | 3,175=9 | ||||
| Conservative hold | Swing | ||||
Elections in the 2010s
| Party | Candidate | Votes | % | ±% | |
|---|---|---|---|---|---|
| Labour | Misfar Hassan | 3,157 | 44.35 | +4.75 | |
| Liberal Democrats | Martin Smith | 2,279 | 32.01 | −5.95 | |
| BNP | Paul McDevitt | 868 | 12.19 | +2.14 | |
| Conservative | Matthew Isherwood | 815 | 11.45 | −0.94 | |
| Majority | 878 | 12.3 | |||
| Turnout | |||||
| Labour gain from Liberal Democrats | Swing | ||||
| Party | Candidate | Votes | % | ±% | |
|---|---|---|---|---|---|
| Conservative | Vivien Taylor | 2,178 | 58.00 | −7.86 | |
| Labour | Kevin Higginson | 877 | 23.36 | +10.30 | |
| UKIP | Simon Noble | 361 | 9.61 | N/A | |
| Green | Susan White | 339 | 9.03 | −12.06 | |
| Majority | 1,301 | ||||
| Turnout | 3,762 | ||||
| Conservative hold | Swing | ||||
| Party | Candidate | Votes | % | ±% | |
|---|---|---|---|---|---|
| Conservative | Alan Cullens | 1,144 | 43.76 | +2.65 | |
| Labour | Yvonne Hargreaves | 1,042 | 38.37 | +0.57 | |
| UKIP | Christopher Stuart | 303 | 11.16 | −6.15 | |
| Liberal Democrats | Stephen Fenn | 125 | 4.60 | +0.83 | |
| Majority | 102 | 3.9 | |||
| Turnout | |||||
| Conservative hold | Swing | ||||
| Party | Candidate | Votes | % | ±% | |
|---|---|---|---|---|---|
| Conservative | Matthew Salter | 1,745 | 60.03 | −6.11 | |
| Labour | Nic Fogg | 925 | 31.82 | +11.01 | |
| Green | Susan White | 237 | 8.15 | −4.90 | |
| Majority | 820 | 59.86 | |||
| Turnout | |||||
| Conservative hold | Swing | ||||
| Party | Candidate | Votes | % | ±% | |
|---|---|---|---|---|---|
| Conservative | Stuart Morris | 1,332 | 48.95 | −14.23 | |
| Liberal Democrats | Andrew Severn | 809 | 29.73 | +21.58 | |
| Labour | Darren Clifford | 580 | 21.32 | −0.71 | |
| Majority | 523 | ||||
| Conservative hold | Swing | ||||
Elections in the 2020s
| Party | Candidate | Votes | % | ±% | |
|---|---|---|---|---|---|
| Labour | Alan Whittaker | 1,642 | 52.1 | +11.1 | |
| Conservative | Val Caunce | 1,279 | 40.6 | −7.9 | |
| Liberal Democrats | Rowan Powers | 231 | 7.3 | +2.0 | |
| Majority | 363 | ||||
| Turnout | |||||
| Labour gain from Conservative | Swing | ||||
| Party | Candidate | Votes | % | ±% | |
|---|---|---|---|---|---|
| Green | Scott Cunliffe | 630 | |||
| Labour | Charles Briggs | 583 | |||
| Conservative | Donald Whitaker | 574 | |||
| Liberal Democrats | Jeff Sumner | 156 | |||
| Majority | 47 | ||||
| Green hold | |||||
The Burnley Central West by-election was triggered by the resignation of Green councillor Andy Fewings.[12]
Notes
- Includes Alliance and Liberal Party. Excludes post-merger Liberals.
- 7 Independent, 2 Our West Lancashire
- 2 Independent.
- 3 Independent.
- 3 Independent.
- Independent.
- Independent.
- Independent.
- 3 Independent, 1 Residents' Association.