Lancaster City Council elections
Class of election in the United Kingdom
From Wikipedia, the free encyclopedia
Lancaster City Council elections are held every four years. Lancaster City Council is the local authority for the non-metropolitan district of Lancaster in Lancashire, England. Since the last boundary changes in 2023, 61 councillors have been elected from 27 wards.[1]

Council elections
- 1973 Lancaster City Council election
- 1976 Lancaster City Council election
- 1979 Lancaster City Council election (New ward boundaries)[2]
- 1983 Lancaster City Council election
- 1987 Lancaster City Council election
- 1991 Lancaster City Council election (City boundary changes took place but the number of seats remained the same)[3]
- 1995 Lancaster City Council election
- 1999 Lancaster City Council election
- 2003 Lancaster City Council election (New ward boundaries)[4][5]
- 2007 Lancaster City Council election
- 2011 Lancaster City Council election
- 2015 Lancaster City Council election (New ward boundaries)[6]
- 2019 Lancaster City Council election
- 2023 Lancaster City Council election (New ward boundaries)[1]
Election results
| Overall control | Labour | Conservative | MB Independent | Green | Lib Dems | Independent | |||||||
| 2023 | NOC | 24 | 5 | 3 | 21 | 7 | 1 | ||||||
| 2019 | NOC | 21 | 12 | 14 | 10 | 3 | - | ||||||
| 2015 | NOC | 29 | 19 | 2 | 9 | - | 1 | ||||||
| 2011 | NOC | 24 | 16 | 8 | 8 | - | 4 | ||||||
| 2007 | NOC | 15 | 12 | 11 | 12 | 5 | 5 | ||||||
| 2003 | NOC | 20 | 10 | 11 | 7 | 8 | 4 | ||||||
Results maps
 2003 results map
 2007 results map
 2011 results map
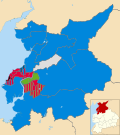 2015 results map
 2019 results map
 2023 results map


By-elections
1995–1999
| Party | Candidate | Votes | % | ±% | |
|---|---|---|---|---|---|
| Labour | 538 | 34.7 | |||
| Conservative | 460 | 29.6 | |||
| Liberal Democrats | 348 | 22.4 | |||
| Morecambe Bay Independents | 206 | 13.3 | |||
| Majority | 78 | 5.1 | |||
| Turnout | 1,552 | 42.8 | |||
| Labour gain from Liberal Democrats | Swing | ||||
| Party | Candidate | Votes | % | ±% | |
|---|---|---|---|---|---|
| Labour | 366 | 38.6 | +0.8 | ||
| Independent | 321 | 33.9 | +33.9 | ||
| Conservative | 261 | 27.5 | −15.0 | ||
| Majority | 45 | 4.7 | |||
| Turnout | 948 | 27.6 | |||
| Labour gain from Conservative | Swing | ||||
| Party | Candidate | Votes | % | ±% | |
|---|---|---|---|---|---|
| Labour | Peter Robinson | 389 | 48.4 | −25.3 | |
| Conservative | 161 | 20.0 | +20.0 | ||
| Morecambe Bay Independent | 142 | 17.7 | +17.7 | ||
| Independent | 77 | 9.6 | +9.6 | ||
| Independent | 30 | 3.7 | −22.6 | ||
| Green | 5 | 0.6 | +0.6 | ||
| Majority | 228 | 28.4 | |||
| Turnout | 804 | ||||
| Labour hold | Swing | ||||
| Party | Candidate | Votes | % | ±% | |
|---|---|---|---|---|---|
| Conservative | James Irey | 421 | 81.0 | +15.0 | |
| Labour | 99 | 19.0 | +19.0 | ||
| Majority | 322 | 62.0 | |||
| Turnout | 520 | ||||
| Conservative hold | Swing | ||||
| Party | Candidate | Votes | % | ±% | |
|---|---|---|---|---|---|
| Conservative | Clive Lamb | 451 | 53.6 | +5.0 | |
| Liberal Democrats | Henry Humphreys | 261 | 31.0 | −0.8 | |
| Labour | Kevin Dixon | 80 | 9.5 | −10.0 | |
| Independent | John Greathead | 50 | 5.9 | +5.9 | |
| Majority | 190 | 22.6 | |||
| Turnout | 842 | 54.1 | |||
| Conservative hold | Swing | ||||
| Party | Candidate | Votes | % | ±% | |
|---|---|---|---|---|---|
| Independent | John Fretwell | 845 | 65.6 | +40.7 | |
| Conservative | David Le Bas | 274 | 21.3 | −12.9 | |
| Labour | Leslie Houghton | 106 | 8.2 | −13.4 | |
| Liberal Democrats | Majorie Buck | 64 | 4.9 | −14.3 | |
| Majority | 571 | 44.3 | |||
| Turnout | 1,289 | 36.8 | |||
| Independent gain from Conservative | Swing | ||||
1999–2003
| Party | Candidate | Votes | % | ±% | |
|---|---|---|---|---|---|
| Liberal Democrats | Liz Scott | 424 | 25.5 | +5.2 | |
| Labour | Richard Newman-Thompson | 395 | 23.8 | −14.6 | |
| Independent | Sheila Kavanagh | 340 | 20.5 | +12.0 | |
| Conservative | Chris Reich | 291 | 17.5 | +0.4 | |
| Green | Peter Gordon | 212 | 12.8 | −2.9 | |
| Majority | 29 | 1.7 | |||
| Turnout | 1,662 | 27.0 | |||
| Liberal Democrats gain from Labour | Swing | ||||
2003–2007
| Party | Candidate | Votes | % | ±% | |
|---|---|---|---|---|---|
| Independent | Garry Baxter | 269 | 37.2 | +9.9 | |
| Independent | Susan Ayrey | 197 | 27.2 | +27.2 | |
| Morecambe Bay Independents | Barbara Williams | 120 | 16.6 | −24.7 | |
| Labour | Darren Clifford | 69 | 9.5 | +9.5 | |
| Conservative | John Battersby-Hill | 55 | 7.6 | −19.6 | |
| Liberal Democrats | Terence Taylor | 14 | 1.9 | +1.9 | |
| Majority | 72 | 10.0 | |||
| Turnout | 724 | 38.0 | |||
| Independent gain from Independent | Swing | ||||
| Party | Candidate | Votes | % | ±% | |
|---|---|---|---|---|---|
| Conservative | Kenneth Brown | 499 | 36.1 | +36.1 | |
| Labour | Darren Clifford | 493 | 35.6 | −0.1 | |
| England First Party | Paul Bamford | 191 | 13.8 | +13.8 | |
| Morecambe Bay Independents | Christopher Greenall | 143 | 10.3 | −39.5 | |
| Liberal Democrats | Terence Taylor | 37 | 2.7 | +2.7 | |
| Green | Ashley Toms | 20 | 1.4 | −13.0 | |
| Majority | 6 | 0.5 | |||
| Turnout | 1,383 | 27.7 | |||
| Conservative gain from Independent | Swing | ||||
| Party | Candidate | Votes | % | ±% | |
|---|---|---|---|---|---|
| Labour | Judith Newton | 353 | 48.5 | +14.9 | |
| Conservative | David Wood | 207 | 28.4 | +11.4 | |
| Independent | Robert Roe | 168 | 23.1 | −3.2 | |
| Majority | 146 | 20.1 | |||
| Turnout | 728 | 21.8 | |||
| Labour hold | Swing | ||||
| Party | Candidate | Votes | % | ±% | |
|---|---|---|---|---|---|
| Labour | Margaret Chadwick | 1,282 | 40.7 | −2.3 | |
| Liberal Democrats | Philip Dunster | 1,115 | 35.4 | +18.0 | |
| Conservative | Sheila Parkinson | 750 | 23.8 | +0.0 | |
| Majority | 167 | 5.3 | |||
| Turnout | 3,147 | ||||
| Labour hold | Swing | ||||
| Party | Candidate | Votes | % | ±% | |
|---|---|---|---|---|---|
| Labour | James Blakely | 466 | 38.0 | −2.7 | |
| Liberal Democrats | Philip Dunster | 287 | 23.4 | −12.0 | |
| Green | Matthew Wootton | 247 | 20.1 | +20.1 | |
| Conservative | William Hill | 226 | 18.4 | −5.4 | |
| Majority | 179 | 14.6 | |||
| Turnout | 1,226 | 23.9 | |||
| Labour hold | Swing | ||||
| Party | Candidate | Votes | % | ±% | |
|---|---|---|---|---|---|
| Labour | Karen Leytham | 493 | 59.1 | +16.1 | |
| Conservative | John Airey | 172 | 20.6 | +1.2 | |
| BNP | Christopher Hill | 93 | 11.2 | +11.2 | |
| Independent | Norman Gardner | 76 | 9.1 | −8.2 | |
| Majority | 321 | 38.5 | |||
| Turnout | 834 | 17.4 | |||
| Labour hold | Swing | ||||
2007–2011
| Party | Candidate | Votes | % | ±% | |
|---|---|---|---|---|---|
| Green | Melanie Forrest | 1,191 | 53.5 | −4.9 | |
| Conservative | Billy Hill | 442 | 19.9 | +5.9 | |
| Labour | Richard Newman-Thompson | 369 | 16.6 | +0.2 | |
| Liberal Democrats | Rebecca Parris | 223 | 10.0 | +2.2 | |
| Majority | 749 | 33.6 | |||
| Turnout | 2,225 | ||||
| Green hold | Swing | ||||
| Party | Candidate | Votes | % | ±% | |
|---|---|---|---|---|---|
| Labour | Elizabeth Scott | 603 | 35.2 | −4.9 | |
| Liberal Democrats | Harry Arrmistead | 389 | 22.7 | +22.7 | |
| Green | Ian Chamberlain | 339 | 19.8 | −17.5 | |
| Conservative | Billy Hill | 301 | 17.6 | −5.1 | |
| UKIP | Fred McGlade | 83 | 4.8 | +4.8 | |
| Majority | 214 | 12.5 | |||
| Turnout | 1,715 | 29.8 | |||
| Labour hold | Swing | ||||
| Party | Candidate | Votes | % | ±% | |
|---|---|---|---|---|---|
| Green | Jack Filmore | 273 | 39.28 | ||
| Labour | James Leyshon | 237 | 34.10 | ||
| Conservative | Daniel Aldred | 128 | 18.42 | ||
| Liberal Democrats | Oliver Mountjoy | 33 | 4.75 | ||
| Independent | Stuart Langhorn | 24 | 3.45 | ||
| Majority | 46 | 6.62 | |||
| Turnout | 695 | ||||
| Green gain from Labour | Swing | ||||
2015–2019
| Party | Candidate | Votes | % | ±% | |
|---|---|---|---|---|---|
| Labour | John Reynolds | 702 | 43.1 | 8.0 | |
| Conservative | John Bassinder | 671 | 41.2 | −6.8 | |
| UKIP | Robert Wilson Gillespie | 134 | 8.2 | N/A | |
| Liberal Democrats | Phil Dunster | 74 | 4.5 | N/A | |
| Green | Cait Sinclair | 49 | 3.0 | −13.9 | |
| Majority | 31 | 1.9 | |||
| Turnout | 695 | ||||
| Labour gain from Conservative | Swing | ||||
| Party | Candidate | Votes | % | ±% | |
|---|---|---|---|---|---|
| Labour | Ian Clift | 443 | 41.6 | 9.1 | |
| MB Independent | Roger Dennison | 193 | 18.1 | 0.4 | |
| UKIP | Michelle Ogden | 183 | 17.2 | −7.5 | |
| Conservative | Daniel Gibbins | 178 | 16.7 | −8.3 | |
| Liberal Democrats | Louise Stansfield | 41 | 3.9 | 3.9 | |
| Green | Richard Moriarty | 26 | 2.4 | 2.4 | |
| Majority | 250 | 1.9 | |||
| Turnout | 695 | 23.5 | |||
| Labour hold | Swing | ||||
| Party | Candidate | Votes | % | ±% | |
|---|---|---|---|---|---|
| Labour | Nathan Burns | 98 | 34.9 | −0.5 | |
| Green | Xeina Aveyard | 79 | 28.1 | −4.4 | |
| Conservative | Luke Brandon | 68 | 24.2 | 0.5 | |
| Liberal Democrats | Pippa Hepworth | 36 | 12.8 | 4.4 | |
| Majority | 19 | 6.8 | |||
| Turnout | 282 | 7.1 | |||
| Labour hold | Swing | ||||
Labour Cllr Karen Leytham (Skerton West) resigned in July 2017. A by-election was held:[22]
| Party | Candidate | Votes | % | ±% | |
|---|---|---|---|---|---|
| Labour | Hilda Jean Parr | 512 | 61 | ||
| Conservative | Andy Kay | 288 | 35 | ||
| Liberal Democrats | Derek John Kaye | 33 | 4 | ||
| Turnout | 833 | 16 | |||
| Labour hold | |||||
Independent Cllr Paul Woodruff (Halton-with-Aughton) resigned in July 2017.[23] A by-election was held:[24]
| Party | Candidate | Votes | % | ±% | ||
|---|---|---|---|---|---|---|
| Labour | Kevin Frea | 247 | 27 | |||
| Green | Jan Maskell | 245 | 27 | |||
| Conservative | Daniel Scott Gibbins | 236 | 26 | |||
| Liberal Democrats | Catherine Pilling | 174 | 19 | |||
| Turnout | 902 | 43 | ||||
| Labour gain from Independent | ||||||
Labour Cllr Roger Sherlock (Skerton West) died in November 2017.[25] A by-election was held:[26]
| Party | Candidate | Votes | % | ±% | |
|---|---|---|---|---|---|
| Labour | Peter Rivet | 587 | 57.8 | +20.8 | |
| Conservative | Andy Kay | 279 | 27.1 | +1.2 | |
| Liberal Democrats | Derek John Kaye | 95 | 9.4 | +9.4 | |
| Green | Cait Sinclair | 59 | 5.8 | −3.7 | |
| Majority | |||||
| Turnout | 1020 | ||||
| Labour hold | |||||
University and Scotforth Rural ward Labour councillors Sam Armstrong (elected Green) and Lucy Atkinson retired in March 2018.[27] A double by-election was held.[26]
| Party | Candidate | Votes | % | ±% | ||
|---|---|---|---|---|---|---|
| Labour | Amara Betts-Patel | 518 | 25.37 | |||
| Labour | Oliver Robinson | 423 | 20.72 | |||
| Green | Martin Paley | 264 | 12.93 | |||
| Green | Jan Maskell | 235 | 11.51 | |||
| Conservative | Callum Furner | 184 | 9.01 | |||
| Conservative | Guy F.P Watts | 184 | 9.01 | |||
| Liberal Democrats | Jade Sullivan | 120 | 5.88 | |||
| Liberal Democrats | Iain Emberry | 114 | 5.58 | |||
| Turnout | 1033 | 27.01 | +19.89 | |||
| Labour gain from Green | ||||||
| Labour hold | ||||||
2019–2023
Conservative councillor Michael Smith (Overton), who is partially deaf resigned in November 2019 because he was "struggling to hear" in meetings.[28] A by-election was held the next month, on the same day as the 2019 United Kingdom general election.
| Party | Candidate | Votes | % | ±% | |
|---|---|---|---|---|---|
| Conservative | Andrew Gardiner | 650 | 52 | 6 | |
| Labour | Tom Porter | 527 | 42 | 0 | |
| Liberal Democrats | Amy Stanning | 65 | 5 | N/A | |
| Turnout | 1242 | 67 | |||
| Conservative hold | |||||
In June 2020, Liberal Democrat councillor Michael Mumford (Kellet) died.[30] Due to the COVID-19 pandemic, no council by-elections will take place in the UK until May 2021 at the earliest.[31]
| Party | Candidate | Votes | % | ±% | ||
|---|---|---|---|---|---|---|
| Conservative | Stuart Morris | 447 | 51 | 6 | ||
| Liberal Democrats | Ross Hunter | 271 | 31 | −14 | ||
| Independent | Kathryn Atkins | 161 | 18 | N/A | ||
| Turnout | 879 | |||||
| Conservative gain from Liberal Democrats | ||||||
| Party | Candidate | Votes | % | ±% | |
|---|---|---|---|---|---|
| Green | Jack Lenox | 1283 | 54 | ||
| Labour | Anna Lee | 824 | 35 | ||
| Conservative | Matthew Maxwell-Scott | 209 | 9 | ||
| Liberal Democrats | Katia Adimora | 45 | 2 | ||
| Turnout | 2361 | ||||
| Green hold | |||||
Jack O'Dwyer-Henry, Eco-Socialist Independent (elected Labour)[33] councillor for the University and Scotforth Rural ward, resigned from the council, triggering a by-election in the ward.[34]
| Party | Candidate | Votes | % | ±% | |
|---|---|---|---|---|---|
| Labour | Fabiha Askari | 216 | 46.1 | ||
| Green | Jamie Payne | 193 | 41.2 | ||
| Conservative | Matthew Maxwell-Scott | 44 | 9.4 | ||
| Liberal Democrats | Zanna Ashton | 16 | 3.4 | ||
| Majority | 23 | 4.9 | |||
| Turnout | 469 | 13.4 | |||
| Labour hold | Swing | ||||
| Party | Candidate | Votes | % | ±% | |
|---|---|---|---|---|---|
| Labour | Luke Taylor | 538 | 57.7 | +20.4 | |
| Conservative | Stuart Bateson | 315 | 33.8 | +1.5 | |
| Green | Patrick McMurray | 54 | 5.8 | −5.1 | |
| Liberal Democrats | Tony Saville | 25 | 2.7 | +2.7 | |
| Majority | 223 | 23.9 | |||
| Turnout | 932 | ||||
| Labour hold | Swing | ||||
| Party | Candidate | Votes | % | ±% | |
|---|---|---|---|---|---|
| Liberal Democrats | Gerry Blaikie | 428 | 33.1 | +21.9 | |
| Green | James Sommerville | 301 | 23.3 | +16.2 | |
| MB Independent | June Ashworth | 243 | 18.8 | −14.1 | |
| Conservative | Jane Cottam | 215 | 16.6 | −12.1 | |
| Labour | Valerie Rogerson | 107 | 8.3 | −7.9 | |
| Majority | 127 | 9.8 | |||
| Turnout | 1,294 | ||||
| Liberal Democrats gain from Conservative | Swing | ||||
| Party | Candidate | Votes | % | ±% | |
|---|---|---|---|---|---|
| Liberal Democrats | Ross Hunter | 390 | 63.1 | +19.1 | |
| Conservative | Iain Harbison | 183 | 29.6 | −16.3 | |
| Green | Nicky Sharkey | 24 | 3.9 | +3.9 | |
| Labour | Faith Kenrick | 21 | 3.4 | −6.7 | |
| Majority | 207 | 33.5 | |||
| Turnout | 618 | ||||
| Liberal Democrats gain from Conservative | Swing | ||||
| Party | Candidate | Votes | % | ±% | |
|---|---|---|---|---|---|
| Green | Sally Maddocks | 547 | 39.7 | +19.5 | |
| Labour | Lisa Corkerry | 418 | 30.4 | −1.1 | |
| Conservative | Janet Walton | 377 | 27.4 | −14.3 | |
| Liberal Democrats | Robert Fildes | 35 | 2.5 | −4.0 | |
| Majority | 129 | 9.4 | |||
| Turnout | 1,377 | ||||
| Green gain from Conservative | Swing | ||||
| Party | Candidate | Votes | % | ±% | |
|---|---|---|---|---|---|
| Labour | Margaret Pattison | 555 | 47.9 | +3.8 | |
| Liberal Democrats | Jake Perkins | 479 | 41.4 | +41.4 | |
| Conservative | Colin Hewitt | 124 | 10.7 | −1.6 | |
| Majority | 76 | 6.6 | |||
| Turnout | 1,158 | ||||
| Labour hold | Swing | ||||
| Party | Candidate | Votes | % | ±% | |
|---|---|---|---|---|---|
| Green | Sue Tyldesley | 452 | 65.7 | +32.8 | |
| Conservative | Iain Harbison | 169 | 24.6 | −22.6 | |
| Labour | Faith Kenrick | 44 | 6.4 | +13.4 | |
| Liberal Democrats | Jane Parsons | 23 | 3.3 | +3.3 | |
| Majority | 283 | 41.1 | |||
| Turnout | 688 | ||||
| Green gain from Conservative | Swing | ||||
2023–2027
Green Party councillor Shelagh McGregor (Castle) resigned in January 2024.[45]
| Party | Candidate | Votes | % | ±% | |
|---|---|---|---|---|---|
| Green | Izzy Metcalf-Riener | 524 | 65.0 | ||
| Labour | Emily Jones | 212 | 26.3 | ||
| Conservative | Daniel Kirk | 43 | 5.3 | ||
| Liberal Democrats | Cormac Evans | 27 | 3.3 | ||
| Majority | 312 | 38.7 | |||
| Turnout | 806 | ||||
| Green hold | Swing | ||||
Labour councillor Paul Gardner (Carnforth and Millhead) died in December 2023.[47]
| Party | Candidate | Votes | % | ±% | |
|---|---|---|---|---|---|
| Labour | Jackson Stubbs | 644 | 47.3 | ||
| Conservative | Peter Yates | 454 | 33.4 | ||
| Green | Emily Heath | 194 | 14.3 | ||
| Liberal Democrats | Lynda Dagdeviren | 69 | 5.1 | ||
| Majority | 190 | 14.0 | |||
| Turnout | 1,361 | ||||
| Labour hold | Swing | ||||
Labour councillor Erin Hall (University) resigned in May 2024.[49]
| Party | Candidate | Votes | % | ±% | |
|---|---|---|---|---|---|
| Green | Maria Deery | 96 | 45.1 | ||
| Labour | Anya Wilkinson-Leishman | 83 | 39.0 | ||
| Conservative | Matthew Maxwell-Scott | 23 | 10.8 | ||
| Liberal Democrats | Thomas Willis | 11 | 5.2 | ||
| Majority | 13 | 6.1 | |||
| Turnout | 213 | 5.9 | |||
| Green gain from Labour | Swing | ||||
Green Party councillor Grace Russell (John O'Gaunt) resigned in March 2025.[51]