Lichfield District Council elections
Local government elections in Staffordshire, England
From Wikipedia, the free encyclopedia
Lichfield District Council elections are held every four years. Lichfield District Council is the local authority for the non-metropolitan district of Lichfield in Staffordshire, England. Since the last boundary changes in 2015, 47 councillors have been elected from 22 wards.[1]
Council elections
- 1973 Lichfield District Council election
- 1976 Lichfield District Council election
- 1979 Lichfield District Council election (New ward boundaries)[2]
- 1983 Lichfield District Council election
- 1987 Lichfield District Council election
- 1991 Lichfield District Council election (District boundary changes took place but the number of seats remained the same)[3][4]
- 1995 Lichfield District Council election (District boundary changes took place but the number of seats remained the same)[5][6]
- 1999 Lichfield District Council election
- 2003 Lichfield District Council election (New ward boundaries)[7][8]
- 2007 Lichfield District Council election
- 2011 Lichfield District Council election
- 2015 Lichfield District Council election (New ward boundaries)[1]
- 2019 Lichfield District Council election
- 2023 Lichfield District Council election
Results maps
 2003 results map
 2007 results map
 2011 results map
 2015 results map
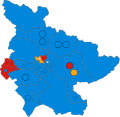 2019 results map
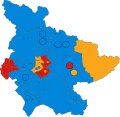 2023 results map


By-election results
1999-2003
| Party | Candidate | Votes | % | ±% | |
|---|---|---|---|---|---|
| Labour | Jim Littlefield | 380 | 50.2 | +11.5 | |
| Conservative | Frank Worrall | 287 | 37.9 | +14.2 | |
| Liberal Democrats | Charles Robinson | 90 | 11.9 | +11.9 | |
| Majority | 93 | 12.3 | |||
| Turnout | 757 | 22.1 | |||
| Labour gain from Independent | Swing | ||||
| Party | Candidate | Votes | % | ±% | |
|---|---|---|---|---|---|
| Conservative | Brenda Constable | 188 | 49.2 | +2.7 | |
| Labour | Hazel Worrallo | 160 | 41.9 | −11.6 | |
| Liberal Democrats | R Paul | 34 | 8.9 | +8.9 | |
| Majority | 28 | 7.3 | |||
| Turnout | 382 | ||||
| Conservative gain from Labour | Swing | ||||
| Party | Candidate | Votes | % | ±% | |
|---|---|---|---|---|---|
| Labour | J James | 292 | 63.6 | −7.8 | |
| Conservative | M Bamborough | 114 | 24.8 | −3.6 | |
| Liberal Democrats | K Morgan | 53 | 11.5 | +11.5 | |
| Majority | 178 | 38.8 | |||
| Turnout | 459 | 19.0 | |||
| Labour hold | Swing | ||||
| Party | Candidate | Votes | % | ±% | |
|---|---|---|---|---|---|
| Labour | D Isaacs | 194 | 58.1 | ||
| Conservative | K Humphreys | 84 | 25.1 | ||
| Liberal Democrats | I Jackson | 56 | 16.8 | ||
| Majority | 110 | 33.0 | |||
| Turnout | 334 | 15.3 | |||
| Labour hold | Swing | ||||
2003-2007
| Party | Candidate | Votes | % | ±% | |
|---|---|---|---|---|---|
| Conservative | 557 | 53.8 | −1.5 | ||
| Liberal Democrats | 352 | 34.0 | +12.3 | ||
| Labour | 126 | 12.2 | −10.8 | ||
| Majority | 205 | 19.8 | |||
| Turnout | 1,035 | 26.0 | |||
| Conservative hold | Swing | ||||
| Party | Candidate | Votes | % | ±% | |
|---|---|---|---|---|---|
| Conservative | Terence Thomas | 192 | 39.2 | −5.9 | |
| Labour | Darren Gilbert | 181 | 36.9 | −4.3 | |
| Liberal Democrats | Marion Bland | 117 | 23.9 | +10.2 | |
| Majority | 11 | 2.3 | |||
| Turnout | 490 | 18.6 | |||
| Conservative gain from Labour | Swing | ||||
2007-2011
| Party | Candidate | Votes | % | ±% | |
|---|---|---|---|---|---|
| Conservative | Rob Strachan | 345 | 65.1 | −5.1 | |
| Liberal Democrats | Penny Bennion | 185 | 34.9 | +5.1 | |
| Majority | 160 | 30.2 | |||
| Turnout | 530 | ||||
| Conservative hold | Swing | ||||
2011-2015
| Party | Candidate | Votes | % | ±% | |
|---|---|---|---|---|---|
| Conservative | Doug Pullen | 423 | 53.0 | −6.7 | |
| Labour | Dave Whatton | 375 | 47.0 | +6.7 | |
| Majority | 48 | 6.0 | |||
| Turnout | 798 | ||||
| Conservative hold | Swing | ||||
| Party | Candidate | Votes | % | ±% | |
|---|---|---|---|---|---|
| Liberal Democrats | Marion Bland | 206 | 36.0 | +4.8 | |
| Labour | Caroline Wood | 157 | 27.4 | −1.6 | |
| UKIP | Bob Green | 108 | 18.8 | +18.8 | |
| Conservative | Jon O'Hagan | 102 | 17.8 | −22.0 | |
| Majority | 49 | 8.6 | |||
| Turnout | 573 | ||||
| Conservative gain from Liberal Democrats | Swing | ||||
2015-2019
| Party | Candidate | Votes | % | ±% | |
|---|---|---|---|---|---|
| Liberal Democrats | Paul Ray | 300 | 40.0 | +14.9 | |
| Labour | Colin Ball | 195 | 26.0 | +1.6 | |
| Conservative | Brian McMullan | 159 | 21.2 | −12.2 | |
| UKIP | Jan Higgins | 73 | 9.7 | −7.4 | |
| Green | Adam Elsdon | 23 | 3.1 | +3.1 | |
| Majority | 105 | 14.0 | |||
| Turnout | 750 | ||||
| Liberal Democrats hold | Swing | ||||
| Party | Candidate | Votes | % | ±% | |
|---|---|---|---|---|---|
| Conservative | Brian Hoult | 652 | 61.5 | +21.9 | |
| Labour | Glen Mynott | 343 | 32.3 | +5.9 | |
| Green | Edwin Jones | 66 | 6.2 | −1.2 | |
| Majority | 309 | 29.1 | |||
| Turnout | 1,061 | ||||
| Conservative gain from UKIP | Swing | ||||
| Party | Candidate | Votes | % | ±% | |
|---|---|---|---|---|---|
| Conservative | Joanne Grange | 513 | 44.8 | −9.1 | |
| Labour | Don Palmer | 299 | 26.1 | −0.9 | |
| Liberal Democrats | Jeyan Anketell | 217 | 19.0 | +19.0 | |
| Something New | Philip Peter | 59 | 5.2 | +5.2 | |
| Green | Mat Hayward | 56 | 4.9 | −14.2 | |
| Majority | 214 | 18.7 | |||
| Turnout | 1,144 | ||||
| Conservative hold | Swing | ||||
| Party | Candidate | Votes | % | ±% | |
|---|---|---|---|---|---|
| Labour | Colin Ball | 309 | 60.4 | +27.2 | |
| Conservative | Jayne Marks | 169 | 33.0 | −8.4 | |
| Liberal Democrats | Lee Cadwallader-Allen | 34 | 6.6 | +6.6 | |
| Majority | 140 | 27.3 | |||
| Turnout | 512 | ||||
| Labour gain from Conservative | Swing | ||||
| Party | Candidate | Votes | % | ±% | |
|---|---|---|---|---|---|
| Conservative | Angela Lax | 499 | 44.1 | −0.7 | |
| Labour | Donald Palmer | 440 | 38.9 | +12.8 | |
| Liberal Democrats | Richard Rathbone | 193 | 17.0 | −2.0 | |
| Majority | 59 | 5.2 | |||
| Turnout | 1,132 | ||||
| Conservative hold | Swing | ||||
2019-2023
| Party | Candidate | Votes | % | ±% | |
|---|---|---|---|---|---|
| Conservative | Heather Tranter | 783 | 57.3 | +21.7 | |
| Labour | Michael Galvin | 392 | 28.7 | −8.6 | |
| Liberal Democrats | John Taylor | 191 | 14.0 | +14.0 | |
| Majority | 391 | 28.6 | |||
| Turnout | 1,366 | ||||
| Conservative gain from Labour | Swing | ||||
| Party | Candidate | Votes | % | ±% | |
|---|---|---|---|---|---|
| Conservative | Richard Cross | 458 | 60.3 | +13.5 | |
| Labour | Mark Pritchard | 301 | 39.7 | +11.7 | |
| Majority | 157 | 20.7 | |||
| Turnout | 759 | ||||
| Conservative hold | Swing | ||||
| Party | Candidate | Votes | % | ±% | |
|---|---|---|---|---|---|
| Labour | Paul Taylor | 318 | 73.3 | +15.2 | |
| Conservative | Norma Bacon | 116 | 26.7 | −15.2 | |
| Majority | 202 | 46.5 | |||
| Turnout | 434 | ||||
| Labour gain from Conservative | Swing | ||||
2023-2027
| Party | Candidate | Votes | % | ±% | |
|---|---|---|---|---|---|
| Reform | Matthew Wallens | 381 | 38.5 | +38.5 | |
| Conservative | Daniel Floyd | 230 | 23.2 | −12.1 | |
| Labour | Liz Stamatelatos | 217 | 21.9 | −42.8 | |
| Green | David Melhuish | 92 | 9.3 | +9.3 | |
| Liberal Democrats | Paul McDermott | 70 | 7.1 | +7.1 | |
| Majority | 151 | 15.3 | |||
| Turnout | 990 | ||||
| Reform gain from Labour | Swing | ||||
| Party | Candidate | Votes | % | ±% | |
|---|---|---|---|---|---|
| Conservative | Richard Stephenson | 690 | 42.4 | −1.1 | |
| Reform | Brandon Clark | 439 | 27.0 | +27.0 | |
| Labour | Glen Bown | 314 | 19.3 | −17.9 | |
| Liberal Democrats | Morag Maclean | 185 | 11.4 | −7.9 | |
| Majority | 251 | 15.4 | |||
| Turnout | 1,628 | ||||
| Conservative hold | Swing | ||||
| Party | Candidate | Votes | % | ±% | |
|---|---|---|---|---|---|
| Conservative | Martyn Punyer | 630 | 46.7 | −6.2 | |
| Reform | Andrew Clissett | 431 | 31.9 | +31.9 | |
| Labour | James Blackman | 127 | 9.4 | −23.5 | |
| Liberal Democrats | Morag Maclean | 99 | 7.3 | −6.8 | |
| Green | David Cullen | 63 | 4.7 | +4.7 | |
| Majority | 199 | 14.7 | |||
| Turnout | 1,350 | ||||
| Conservative hold | Swing | ||||