Maidstone Borough Council elections
Local government elections in Kent, England
From Wikipedia, the free encyclopedia
Elections to Maidstone Borough Council in Kent, United Kingdom are held each year to elect one-third of its members, followed by one year without election. Since the last boundary changes in 2002, 55 councillors have been elected from 26 wards.[1] From 2024 onwards, the format of elections will change, with all 49 councillors being elected once every 4 years.
Council composition
| Year | Conservative | Liberal Democrats[a] | Labour | Green | UKIP | Independents & Others |
Council control after election | |
|---|---|---|---|---|---|---|---|---|
| Local government reorganisation; council established (60 seats) | ||||||||
| 1973 | 13 | 19 | 12 | – | – | 16 | No overall control | |
| 1976 | 39 | 7 | 7 | 0 | – | 7 | Conservative | |
| New ward boundaries (55 seats) | ||||||||
| 1979 | 34 | 7 | 10 | 0 | – | 0 | Conservative | |
| 1980 | 32 | 9 | 10 | 0 | – | 4 | Conservative | |
| 1982 | 28 | 15 | 9 | 0 | – | 3 | Conservative | |
| 1983 | 27 | 17 | 8 | 0 | – | 3 | No overall control | |
| 1984 | 24 | 20 | 8 | 0 | – | 3 | No overall control | |
| 1986 | 20 | 23 | 9 | 0 | – | 3 | No overall control | |
| 1987 | 20 | 25 | 8 | 0 | – | 2 | No overall control | |
| 1988 | 22 | 23 | 8 | 0 | – | 2 | No overall control | |
| 1990 | 20 | 23 | 8 | 0 | – | 4 | No overall control | |
| 1991 | 20 | 22 | 9 | 0 | – | 4 | No overall control | |
| 1992 | 27 | 16 | 8 | 0 | – | 4 | No overall control | |
| 1994 | 23 | 17 | 10 | 0 | 0 | 5 | No overall control | |
| 1995 | 17 | 17 | 15 | 0 | 0 | 6 | No overall control | |
| 1996 | 11 | 21 | 18 | 0 | 0 | 5 | No overall control | |
| 1998 | 13 | 21 | 16 | 0 | 0 | 5 | No overall control | |
| 1999 | 15 | 22 | 13 | 0 | 0 | 5 | No overall control | |
| 2000 | 16 | 22 | 12 | 0 | 0 | 5 | No overall control | |
| New ward boundaries (55 seats) | ||||||||
| 2002 | 19 | 21 | 12 | 0 | 0 | 3 | No overall control | |
| 2003 | 21 | 21 | 10 | 0 | 0 | 3 | No overall control | |
| 2004 | 23 | 20 | 9 | 0 | 0 | 3 | No overall control | |
| 2006 | 27 | 20 | 5 | 0 | 0 | 3 | No overall control | |
| 2007 | 26 | 21 | 4 | 0 | 0 | 4 | No overall control | |
| 2008 | 29 | 20 | 1 | 0 | 0 | 5 | Conservative | |
| 2010 | 28 | 23 | 0 | 0 | 0 | 4 | Conservative | |
| New ward boundaries (55 seats) | ||||||||
| 2011 | 30 | 21 | 0 | 0 | 0 | 4 | Conservative | |
| 2012 | 30 | 19 | 1 | 0 | 0 | 5 | Conservative | |
| 2014 | 25 | 19 | 2 | 0 | 4 | 5 | No overall control | |
| 2015 | 25 | 20 | 2 | 0 | 4 | 4 | No overall control | |
| 2016 | 23 | 22 | 2 | 0 | 5 | 3 | No overall control | |
| 2018 | 27 | 19 | 3 | 0 | 1 | 0 | No overall control | |
| 2019 | 25 | 20 | 4 | 0 | 1 | 5 | No overall control | |
| 2021 | 29 | 17 | 4 | 0 | 0 | 5 | Conservative | |
| 2022 | 27 | 12 | 5 | 1 | 0 | 10 | No overall control | |
| 2023 | 24 | 12 | 6 | 3 | 0 | 10 | No overall control | |
| New ward boundaries (49 seats) | ||||||||
| 2024 | 13 | 12 | 6 | 10 | 0 | 8[b] | No overall control | |
Borough result maps
 2002 results map
 2003 results map
 2004 results map
 2006 results map
 2007 results map
 2008 results map
 2010 results map
 2011 results map
 2012 results map
 2014 results map
 2015 results map
 2016 results map
 2018 results map
 2019 results map
 2021 results map
 2022 results map
 2023 results map
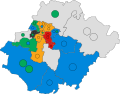 2024 results map


By-elections
1994-1998
| Yalding Ward By-Election 1 May 1997[3] | ||||||
|---|---|---|---|---|---|---|
| Candidate | Party | Votes | % | ±% | ||
| Conservative Party | 1,000 | 44.44% | +12.1% | |||
| Liberal Democrats | 643 | 28.58% | -15.2% | |||
| Labour Party | 607 | 26.98% | +7.3% | |||
| Total | 2,250 | 100.00% | ||||
| Rejected Ballot Papers | ||||||
| Ballot Papers Issued | ||||||
| Registered Electors | ||||||
| Turnout | ||||||
| Conservative gain from Liberal Democrats | ||||||
| Loose Ward By-Election 3 July 1997[4] | ||||||
|---|---|---|---|---|---|---|
| Candidate | Party | Votes | % | ±% | ||
| Liberal Democrats | 283 | 59.08% | -13.8% | |||
| Conservative Party | 117 | 24.43% | +8.2% | |||
| Labour Party | 79 | 16.49% | +5.5% | |||
| Total | 479 | 100.00% | ||||
| Rejected Ballot Papers | ||||||
| Ballot Papers Issued | ||||||
| Registered Electors | ||||||
| Turnout | 25.4% | |||||
| Liberal Democrats hold | ||||||
| High Street Ward By-Election 13 November 1997[5] | ||||||
|---|---|---|---|---|---|---|
| Candidate | Party | Votes | % | ±% | ||
| Liberal Democrats | 350 | 39.64% | -3.0% | |||
| Labour Party | 310 | 35.11% | -5.8% | |||
| Conservative Party | 123 | 13.93% | +0.1% | |||
| Maidstone First | 73 | 8.27% | +8.3% | |||
| Green Party | 27 | 3.06% | +0.4% | |||
| Total | 883 | 100.00% | ||||
| Rejected Ballot Papers | ||||||
| Ballot Papers Issued | ||||||
| Registered Electors | ||||||
| Turnout | 19.8% | |||||
| Liberal Democrats gain from Labour | ||||||
1998-2002
| Allington Ward By-Election 29 October 1998[6][7] | ||||||
|---|---|---|---|---|---|---|
| Candidate | Party | Votes | % | ±% | ||
| Cynthia Elizabeth Robertson | Liberal Democrats | 744 | 72.16% | +5.2% | ||
| Margaret Helen June Taylor | Labour Party | 159 | 15.42% | -0.3% | ||
| Helen Violet Mortimer | Conservative Party | 128 | 12.42% | +2.8% | ||
| Total | 1,031 | 100.00% | ||||
| Rejected Ballot Papers | 0 | |||||
| Ballot Papers Issued | 1,031 | |||||
| Registered Electors | ||||||
| Turnout | 18.5% | |||||
| Liberal Democrats hold | ||||||
| Boxley Ward By-Election 29 October 1998[8][9] | ||||||
|---|---|---|---|---|---|---|
| Candidate | Party | Votes | % | ±% | ||
| Michael Ian Yates | Conservative Party | 630 | 63.25% | +23.1% | ||
| John Brian Doherty | Liberal Democrats | 201 | 20.18% | +6.1% | ||
| Stephen Gibson | Labour Party | 165 | 16.57% | -25.5% | ||
| Total | 996 | 100.00% | ||||
| Rejected Ballot Papers | 2 | |||||
| Ballot Papers Issued | 998 | |||||
| Registered Electors | ||||||
| Turnout | 14.1% | |||||
| Conservative gain from Independent | ||||||
| Hollingbourne Ward By-Election 29 October 1998[10][11] | ||||||
|---|---|---|---|---|---|---|
| Candidate | Party | Votes | % | ±% | ||
| Tracy Ann Helen Warner | Conservative Party | 198 | 48.29% | -12.0% | ||
| Paul Geoffrey Begg | Liberal Democrats | 193 | 47.07% | +25.1% | ||
| Jeanne Mary Gibson | Labour Party | 19 | 4.63% | -13.1% | ||
| Total | 410 | 100.00% | ||||
| Rejected Ballot Papers | 0 | |||||
| Ballot Papers Issued | 410 | |||||
| Registered Electors | ||||||
| Turnout | 35.3% | |||||
| Conservative hold | ||||||
2002-2006
| Marden & Yalding Ward By-Election 27 November 2003[12][13] | ||||||
|---|---|---|---|---|---|---|
| Candidate | Party | Votes | % | ±% | ||
| Paddy C. J. Germain | Conservative Party | 726 | 49.83% | -12.5% | ||
| Carol A. Jacques | Liberal Democrats | 535 | 36.72% | +18.4% | ||
| John M. Hughes | Labour Party | 153 | 10.50% | -4.0% | ||
| Brian Hogg | UK Independence Party | 43 | 2.95% | -1.8% | ||
| Total | 1,457 | 100.00% | ||||
| Rejected Ballot Papers | ||||||
| Ballot Papers Issued | ||||||
| Registered Electors | ||||||
| Turnout | 24.4% | |||||
| Conservative hold | ||||||
| Downswood & Otham Ward By-Election 13 October 2005[14][15] | ||||||
|---|---|---|---|---|---|---|
| Candidate | Party | Votes | % | ±% | ||
| David Marchant | Independent | 314 | 61.33% | +15.0% | ||
| Timothy M. Crockford | Conservative Party | 184 | 35.94% | +17.2% | ||
| Audrey D. Gardner | Labour Party | 14 | 2.73% | +2.3% | ||
| Total | 512 | 100.00% | ||||
| Rejected Ballot Papers | ||||||
| Ballot Papers Issued | ||||||
| Registered Electors | ||||||
| Turnout | 24.4% | |||||
| Independent hold | ||||||
2006-2010
| Parkwood Ward By-Election 30 November 2006[16][17] | ||||||
|---|---|---|---|---|---|---|
| Candidate | Party | Votes | % | ±% | ||
| Robert Field | Liberal Democrats | 347 | 57.64% | +23.5% | ||
| Wesley Mason | Labour Party | 130 | 21.59% | -13.3% | ||
| Scott Hahnefeld | Conservative Party | 125 | 20.76% | -10.1% | ||
| Total | 602 | 100.00% | ||||
| Rejected Ballot Papers | 2 | |||||
| Ballot Papers Issued | 604 | |||||
| Registered Electors | ||||||
| Turnout | 19.3% | |||||
| Liberal Democrats gain from Labour | ||||||
| Shepway South Ward By-Election 6 December 2007[18][19] | ||||||
|---|---|---|---|---|---|---|
| Candidate | Party | Votes | % | ±% | ||
| Sheena Williams | Conservative Party | 251 | 35.96% | -9.7% | ||
| Gill Annan | Labour Party | 240 | 34.38% | +34.4% | ||
| Bryan Charles Vizzard | Liberal Democrats | 173 | 24.79% | -22.0% | ||
| Stephen Fraser Muggeridge | Green Party | 34 | 4.87% | -2.6% | ||
| Total | 698 | 100.00% | ||||
| Rejected Ballot Papers | ||||||
| Ballot Papers Issued | ||||||
| Registered Electors | ||||||
| Turnout | 16.1% | |||||
| Conservative gain from Labour | ||||||
| Fant Ward By-Election 1 October 2009[20] | ||||||
|---|---|---|---|---|---|---|
| Candidate | Party | Votes | % | ±% | ||
| Fran Smith | Liberal Democrats | 702 | 46.37% | +18.8% | ||
| Paul Butcher | Conservative Party | 393 | 25.96% | -7.4% | ||
| Stuart Jeffery | Green Party | 317 | 20.94% | +4.9% | ||
| Bruce Heald | Labour Party | 102 | 6.74% | -16.3% | ||
| Total | 1,514 | 100.00% | ||||
| Rejected Ballot Papers | ||||||
| Ballot Papers Issued | ||||||
| Registered Electors | ||||||
| Turnout | 23.6% | |||||
| Liberal Democrats hold | ||||||
2010-2014
A by-election was held in Allington Ward following the death of Malcolm Robertson on 10 August 2012.[21][22]
| Allington Ward By-Election 18 October 2012[23] | ||||||
|---|---|---|---|---|---|---|
| Candidate | Party | Votes | % | ±% | ||
| Belinda Janet Watson | Liberal Democrats | 885 | 52.37% | |||
| Barry Stephen Ginley | Conservative Party | 434 | 25.68% | |||
| Marianna Romeojuliet Poliszczuk | Labour Party | 179 | 10.59% | |||
| Gareth Anthony Kendall | UK Independence Party | 162 | 9.59% | |||
| Jill Shepherd | Green Party | 30 | 1.78% | |||
| Total | 1,690 | 100.00% | ||||
| Rejected Ballot Papers | 9 | |||||
| Ballot Papers Issued | 1,699 | |||||
| Registered Electors | 5,604 | |||||
| Turnout | 30.32% | |||||
| Liberal Democrats hold | ||||||
2014-2018
| Party | Candidate | Votes | % | ±% | |
|---|---|---|---|---|---|
| Liberal Democrats | Paulina Watson | 609 | 36.2 | +9.1 | |
| Conservative | Louise Brice | 603 | 35.9 | +3.0 | |
| UKIP | Jamie Kalmar | 311 | 18.5 | −5.0 | |
| Labour | John Randall | 117 | 7.0 | −0.8 | |
| Green | David George | 41 | 2.4 | −1.1 | |
| Majority | 6 | 0.4 | |||
| Turnout | 1,681 | ||||
| Liberal Democrats gain from Conservative | Swing | ||||
| Party | Candidate | Votes | % | ±% | |
|---|---|---|---|---|---|
| Conservative | Matt Boughton | 477 | 27.1 | −2.6 | |
| Liberal Democrats | Rosaline Janko | 424 | 24.1 | +2.1 | |
| Labour | Keith Adkinson | 352 | 20.0 | −0.4 | |
| Green | Stuart Jeffery | 249 | 14.2 | +3.9 | |
| UKIP | Colin Taylor | 180 | 10.2 | −7.4 | |
| Independent | Mike Hogg | 75 | 4.3 | +4.3 | |
| Majority | 53 | 3.0 | |||
| Turnout | 1,757 | ||||
| Conservative hold | Swing | ||||
| Party | Candidate | Votes | % | ±% | |
|---|---|---|---|---|---|
| UKIP | John Barned | 432 | 45.5 | +7.2 | |
| Conservative | Bob Hinder | 215 | 22.7 | −5.1 | |
| Labour | Dan Wilkinson | 183 | 19.3 | −5.5 | |
| Independent | Jon Hicks | 88 | 9.3 | +9.3 | |
| Liberal Democrats | Milden Choongo | 31 | 3.3 | −2.6 | |
| Majority | 217 | 22.9 | |||
| Turnout | 949 | ||||
| UKIP hold | Swing | ||||
| Party | Candidate | Votes | % | ±% | |
|---|---|---|---|---|---|
| Conservative | Denis Spooner | 1,713 | 72.7 | +36.1 | |
| Labour | Tim Licence | 253 | 10.7 | +1.5 | |
| Liberal Democrats | Karen Davies | 250 | 10.6 | +7.4 | |
| Green | Ciaran Oliver | 141 | 6.0 | +2.7 | |
| Majority | 1,460 | 61.9 | |||
| Turnout | 2,357 | ||||
| Conservative hold | Swing | ||||
| Party | Candidate | Votes | % | ±% | |
|---|---|---|---|---|---|
| Labour | Cleator, Maureen | 270 | 19.3% | ||
| Green | Eagle, Derek | 47 | 3.4% | ||
| Liberal Democrats | Field, Rob | 719 | 51.4% | ||
| Conservative | Taylor-Maggio, Cheryl Janette | 270 | 25.9% | ||
| Total votes | 1399 | ||||
| Liberal Democrats gain from Conservative | Swing | ||||
2018-2022
| Party | Candidate | Votes | % | ±% | |
|---|---|---|---|---|---|
| Conservative | Karen Chappell-Tay | 686 | 57.3 | −17.5 | |
| Liberal Democrats | Merilyn Fraser | 409 | 34.1 | +19.6 | |
| Labour | Jim Grogan | 63 | 5.3 | −5.5 | |
| Green | Derek Eagle | 40 | 3.3 | +3.3 | |
| Majority | 277 | 23.1 | |||
| Turnout | 1,198 | ||||
| Conservative hold | Swing | ||||
2022-2026
| Party | Candidate | Votes | % | ±% | |
|---|---|---|---|---|---|
| Reform | Chris Houlihan | 1,228 | |||
| Reform | Steve Povey | 1,226 | |||
| Reform | Mariela Nedelcheva | 1,153 | |||
| Green | Callum Sweetman | 459 | |||
| Green | James Snyder | 452 | |||
| Green | Reshmi Kalam | 430 | |||
| Conservative | Isobelle Horne | 342 | |||
| Conservative | Darcy Rotherham | 285 | |||
| Liberal Democrats | Jennifer Horwood | 236 | |||
| Conservative | Onyekachukwu Chukwuma | 234 | |||
| Liberal Democrats | Sam Burrows | 156 | |||
| Liberal Democrats | Andrew Cockersole | 123 | |||
| Heritage | Sean Turner | 97 | |||
| Independent | Gary Butler | 74 | |||
| Independent | Sam Lawrence-Rose | 69 | |||
| Reform gain from Independent | Swing | ||||
| Reform gain from Independent | Swing | ||||
| Reform gain from Independent | Swing | ||||
See also
- 2002 Maidstone Borough Council election (New ward boundaries)[32][33]
- 2011 Maidstone Borough Council election (Some new ward boundaries)[34]
- 2021 Maidstone Borough Council election (postponed from 2020 due to the COVID-19 pandemic)[35]
- 2023 Maidstone Borough Council election (last elections held under old format)
- 2024 Maidstone Borough Council election (first election under 4-year cycle)
Notes
- Includes totals for the predecessors of the Liberal Democrats, the Liberal Party and SDP (both of which participated in the Alliance).
- Including 2 Fant & Oakwood Independents