Medway Council elections
Elections in Kent, England
From Wikipedia, the free encyclopedia
Medway Council is the local authority for the unitary authority of Medway in Kent, England. It was created on 1 April 1998 replacing Gillingham Borough Council and Rochester-upon-Medway.
Political control
The first election to the council was held in 1997, initially operating as a shadow authority until formally taking over from the two outgoing councils on 1 April 1998. Since 1997 political control of the council has been held by the following parties:[1][2]
| Party in control | Years | |
|---|---|---|
| Labour | 1997–1998 | |
| No overall control | 1998–2003 | |
| Conservative | 2003–2023 | |
| Labour | 2023–present | |
Leadership
The leaders of the council since 2000 have been:[3]
| Councillor | Party | From | To | |
|---|---|---|---|---|
| Rodney Chambers | Conservative | May 2000 | 27 May 2015 | |
| Alan Jarrett | Conservative | 27 May 2015 | ||
| Vince Maple | Labour | 4 May 2023 | ||
Council composition
| Year | Conservative | Labour | Liberal Democrats[a] | UKIP | Independents & Others |
Council control after election | ||
|---|---|---|---|---|---|---|---|---|
| Created from the merger of Rochester-upon-Medway and Gillingham (80 seats) | ||||||||
| 1997 | 20 | 39 | 21 | 0 | 0 | Labour | ||
| 2000 | 38 | 25 | 15 | 0 | 2 | No overall control | ||
| New ward boundaries (55 seats) | ||||||||
| 2003 | 30 | 17 | 6 | 0 | 2 | Conservative | ||
| 2007 | 33 | 13 | 8 | 0 | 0 | Conservative | ||
| 2011 | 35 | 15 | 3 | 0 | 2 | Conservative | ||
| 2015 | 36 | 15 | 0 | 4 | 0 | Conservative | ||
| 2019 | 33 | 20 | 0 | 0 | 2 | Conservative | ||
| New ward boundaries (59 seats) | ||||||||
| 2023 | 22 | 33 | 0 | 0 | 4 | Labour | ||
Council elections
- 1997 Medway Council election (New ward boundaries)[4]
- 2000 Medway Council election
- 2003 Medway Council election (New ward boundaries reduced the number of seats by 25)[5][6][7]
- 2007 Medway Council election
- 2011 Medway Council election
- 2015 Medway Council election
- 2019 Medway Council election
- 2023 Medway Council election (New ward boundaries increased the number of seats by 4)[8]
Results maps
 2003 results map
 2007 results map
 2011 results map
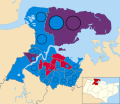 2015 results map
 2019 results map
 2023 results map


By-election results
1998–2003
| Party | Candidate | Votes | % | ±% | |
|---|---|---|---|---|---|
| Liberal Democrats | Dayantha Liyanage | 656 | 54.3 | +6.7 | |
| Labour | Pamela Holman | 372 | 30.8 | +0.8 | |
| Conservative | Roy Hunter | 180 | 14.9 | −7.5 | |
| Majority | 284 | 23.5 | |||
| Turnout | 1,208 | 27.0 | |||
| Liberal Democrats hold | Swing | ||||
2007–2011
| Party | Candidate | Votes | % | ±% | |
|---|---|---|---|---|---|
| Conservative | Trevor Clarke | 1,847 | 48.7 | +7.2 | |
| Labour | Adam Price | 819 | 21.6 | −5.0 | |
| Liberal Democrats | Viv Parker | 767 | 20.2 | +3.6 | |
| BNP | Brian Ravenscroft | 257 | 6.8 | +6.8 | |
| Green | Simon Marchant | 104 | 2.7 | +2.7 | |
| Majority | 1,028 | 27.1 | |||
| Turnout | 3,794 | 41.0 | |||
| Conservative hold | Swing | ||||
This by-election was triggered by the resignation of Conservative Councillor John Ward
| Party | Candidate | Votes | % | ±% | |
|---|---|---|---|---|---|
| Conservative | Tashi Bhutia | 1,042 | 36.9 | +10.8 | |
| Labour | Sam Whittington | 1,038 | 36.7 | −12.3 | |
| Liberal Democrats | Gary Allanach | 223 | 7.9 | +7.9 | |
| UKIP | Robin Johnson | 200 | 7.1 | +7.1 | |
| BNP | Brian Ravenscroft | 186 | 6.6 | +6.6 | |
| Independent | Brian Cartwright | 87 | 3.1 | −21.9 | |
| Green | Sarah D'Angelo | 51 | 1.8 | +1.8 | |
| Majority | 4 | 0.2 | |||
| Turnout | 2,827 | 29.8 | |||
| Conservative gain from Labour | Swing | ||||
This by-election was triggered by the resignation of Labour Councillor Dennis McFarlane
| Party | Candidate | Votes | % | ±% | |
|---|---|---|---|---|---|
| Conservative | David Craggs | 617 | 45.8 | ||
| Labour | John Jones | 544 | 40.4 | ||
| Liberal Democrats | Garry Harrison | 104 | 7.7 | ||
| Green | Steven Keevil | 45 | 3.3 | ||
| BNP | Brian Ravenscroft | 39 | 2.8 | ||
| English Democrat | Ron Sands | 33 | 2.4 | ||
| Majority | 73 | 5.3 | |||
| Turnout | 1,382 | ||||
| Conservative gain from Labour | Swing | ||||
This by-election was triggered by the resignation of Labour Councillor Bill Esterson
| Party | Candidate | Votes | % | ±% | |
|---|---|---|---|---|---|
| Labour | John Jones | 695 | 45.5 | ||
| Conservative | Andrew Mackness | 631 | 41.3 | ||
| Liberal Democrats | Garry Harrison | 92 | 6.0 | ||
| UKIP | Anthony Cook | 42 | 2.8 | ||
| Green | Steven Keevil | 36 | 2.4 | ||
| English Democrat | Ron Sands | 31 | 2.0 | ||
| Majority | 64 | 4.2 | |||
| Turnout | 1527 | 25.7 | |||
| Labour gain from Conservative | Swing | ||||
This by-election was triggered by the resignation of Conservative Councillor David Craggs
2011–2015
| Party | Candidate | Votes | % | ±% | |
|---|---|---|---|---|---|
| UKIP | Christopher Irvine | 2,850 | 48.3 | +48.3 | |
| Conservative | Ron Sands | 1,965 | 33.3 | −20.9 | |
| Labour | Pete Tungate | 716 | 12.1 | −8.6 | |
| Green | Clive Gregory | 314 | 5.3 | −2.1 | |
| Liberal Democrats | Christopher Sams | 60 | 1.0 | −5.3 | |
| Majority | 885 | 15.0 | |||
| Turnout | 5,905 | ||||
| UKIP gain from Conservative | Swing | ||||
2015–2019
| Party | Candidate | Votes | % | ±% | |
|---|---|---|---|---|---|
| Conservative | Josie Iles | 724 | 38.4 | +3.4 | |
| Labour | Isaac Igwe | 521 | 27.7 | +3.4 | |
| UKIP | Karl Weller | 480 | 25.5 | −13.2 | |
| Green | Steve Dyke | 74 | 3.9 | N/A | |
| Liberal Democrats | Isabelle Cherry | 62 | 3.3 | N/A | |
| English Democrat | Mike Russell | 23 | 1.2 | N/A | |
| Majority | 203 | 10.7 | |||
| Turnout | 1,884 | 16.74 | |||
| Conservative gain from UKIP | Swing | ||||
The by-election was triggered by the resignation of UKIP Councillor Catriona Brown-Reckless
| Party | Candidate | Votes | % | ±% | |
|---|---|---|---|---|---|
| Conservative | Jan Aldous | 1,448 | 61.1 | ||
| UKIP | Mark Mencattelli | 389 | 16.4 | ||
| Labour | Simon Allen | 320 | 13.5 | ||
| Liberal Democrats | Paul Chaplin | 137 | 5.8 | ||
| Green | George Meegan | 61 | 2.6 | ||
| English Democrat | Mike Russell | 14 | 0.6 | ||
| Majority | 1,059 | 44.7 | |||
| Turnout | 2,369 | 24.0 | |||
| Conservative hold | Swing | ||||
The by-election was triggered by the death of Conservative Councillor Mike O'Brien
| Party | Candidate | Votes | % | ±% | |
|---|---|---|---|---|---|
| Labour | Alex Paterson | 1,212 | 47.5 | +26.5 | |
| Conservative | Alan Kew | 1007 | 39.5 | −4.0 | |
| Liberal Democrats | Martin Rose | 119 | 4.7 | +1.0 | |
| Green | Sonia Hyner | 107 | 4.2 | −6.1 | |
| UKIP | Rob McCulloch Martin | 104 | 4.1 | −16.2 | |
| Majority | 205 | 8.0 | −5.0 | ||
| Turnout | 2,549 | 33 | |||
| Labour gain from Conservative | Swing | ||||
The by-election was triggered by the resignation of Conservative Councillor Kelly Tolhurst
2019–2023
| Party | Candidate | Votes | % | ±% | |
|---|---|---|---|---|---|
| Conservative | Robert George Benedict Lammas | 961 | 67.1 | +19.1 | |
| Labour | John Gower Strevens | 313 | 21.9 | −5.6 | |
| Green | Sonia Lesley Hyner | 52 | 3.6 | N/A | |
| Independent | Matthew Bernard Durcan | 51 | 3.6 | N/A | |
| Liberal Democrats | John Edward Castle | 49 | 3.4 | N/A | |
| Majority | 648 | 45.2 | |||
| Turnout | 1,432 | 18.8 | |||
| Conservative hold | Swing | ||||
| Party | Candidate | Votes | % | ±% | |
|---|---|---|---|---|---|
| Labour | Zöe Angela Van Dyke | 913 | 37.0 | +6.4 | |
| Conservative | Mark Paul Joy | 728 | 29.5 | −2.5 | |
| Green | Catriona Margaret Jamieson | 565 | 10.5 | +1.0 | |
| Independent | Christopher Stuart Spalding | 216 | 8.8 | N/A | |
| Liberal Democrats | Alan Edward Wells | 39 | 1.6 | N/A | |
| Majority | 185 | 7.5 | |||
| Turnout | 2,466 | 23.5 | |||
| Labour gain from Conservative | Swing | ||||
| Party | Candidate | Votes | % | ±% | |
|---|---|---|---|---|---|
| Labour | Lauren Edwards | 870 | 63.3 | +15.2 | |
| Conservative | Brian Griffin | 388 | 28.2 | +8.6 | |
| Green | Bernard Hyde | 69 | 5.0 | −9.2 | |
| Liberal Democrats | Sarah Manuel | 48 | 3.5 | −2.8 | |
| Majority | 482 | 35.1 | |||
| Turnout | 1,375 | ||||
| Labour hold | Swing | ||||
| Party | Candidate | Votes | % | ±% | |
|---|---|---|---|---|---|
| Independent | George Crozer | 1,038 | 46.6 | +46.6 | |
| Conservative | Harold Ogunfemi | 371 | 16.7 | −9.2 | |
| Green | Julian Sutton | 255 | 11.5 | +1.5 | |
| Independent | Chris Spalding | 230 | 10.3 | +10.3 | |
| Labour | David Hodges | 215 | 9.7 | −0.4 | |
| Independent | Sharon Jackson | 89 | 4.0 | +4.0 | |
| Liberal Democrats | Ben Rist | 29 | 1.3 | +1.3 | |
| Majority | 667 | 30.0 | |||
| Turnout | 2,227 | ||||
| Independent hold | Swing | ||||
2023–2027
| Party | Candidate | Votes | % | ±% | |
|---|---|---|---|---|---|
| Labour | Liubov Nestorova | 706 | 37.4 | −19.9 | |
| Reform | Rizvi Rawoof | 506 | 26.8 | +26.8 | |
| Conservative | Saboor Ahmed | 330 | 17.5 | −0.5 | |
| Green | Trish Marchant | 167 | 8.8 | −4.4 | |
| Liberal Democrats | Onyx Rist | 99 | 5.2 | −6.2 | |
| SDP | Peter Wheeler | 69 | 3.7 | +3.7 | |
| Heritage | Roshan Bhunnoo | 12 | 0.6 | +0.6 | |
| Majority | 200 | 10.6 | |||
| Turnout | 1,889 | ||||
| Labour hold | Swing | ||||
| Party | Candidate | Votes | % | ±% | |
|---|---|---|---|---|---|
| Reform | David Finch | 870 | |||
| Reform | John Vye | 802 | |||
| Labour | Carolyn Hart | 781 | |||
| Labour | Robert Wyatt | 717 | |||
| Conservative | George Clarke | 479 | |||
| Conservative | Tolga Sirlan | 432 | |||
| Green | Doug Bray | 141 | |||
| Green | Jeremy Spyby-Steanson | 109 | |||
| Liberal Democrats | Anita Holloway | 81 | |||
| Liberal Democrats | Sarah Manuel | 80 | |||
| Heritage | Peter Burch | 21 | |||
| Majority | |||||
| Turnout | 2,317 | 24.4% | |||
| Reform gain from Labour | Swing | ||||
| Reform gain from Labour | Swing | ||||
Notes
- Includes totals for the predecessors of the Liberal Democrats, the Liberal Party and SDP (both of which participated in the Alliance).