Midlothian Council elections
From Wikipedia, the free encyclopedia
Local government elections in Midlothian, Scotland
Midlothian Council in Scotland holds elections every five years, previously holding them every four years from its creation as a single-tier authority in 1995 to 2007.
As a district council
| Year | SNP | Labour | Conservative | Liberal[a] | Independent |
|---|---|---|---|---|---|
| 1974 | 1 | 11 | 2 | 0 | 1 |
| 1977 | 5 | 7 | 2 | 0 | 1 |
| 1980[b] | 0 | 13 | 0 | 1 | 1 |
| 1984 | 0 | 14 | 1 | 1 | 0 |
| 1988 | 0 | 14 | 1 | 0 | 0 |
| 1992 | 1 | 12 | 1 | 0 | 0 |
- ↑ Alliance from 1981 to 1988, Liberal Democrats from 1988 to 1995.
- ↑ New ward boundaries.[1]
As a unitary authority
| Year | SNP | Labour | Conservative | Liberal Democrats | Green | Independent |
|---|---|---|---|---|---|---|
| 1995 | 2 | 13 | 0 | 0 | 0 | 0 |
| 1999[a] | 0 | 17 | 0 | 1 | 0 | 0 |
| 2003 | 0 | 15 | 0 | 2 | 0 | 1 |
| 2007[b] | 6 | 9 | 0 | 3 | 0 | 0 |
| 2012 | 8 | 8 | 0 | 0 | 1 | 1 |
| 2017[c] | 6 | 7 | 5 | 0 | 0 | 0 |
| 2022 | 8 | 7 | 3 | 0 | 0 | 0 |
Results maps
 1980 results map
 1988 results map
 1992 results map
 1999 results map
 2003 results map
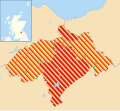 2007 results map
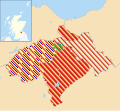 2012 results map


By-elections
2003-2007
| Party | Candidate | Votes | % | ±% | |
|---|---|---|---|---|---|
| Liberal Democrats | 742 | 52.6 | +30.4 | ||
| Labour | 418 | 29.6 | −18.6 | ||
| SNP | 179 | 12.7 | −4.9 | ||
| Scottish Socialist | 48 | 3.4 | −5.3 | ||
| Conservative | 24 | 1.7 | −1.6 | ||
| Majority | 324 | 23.0 | |||
| Turnout | 1,411 | ||||
| Liberal Democrats gain from Labour | Swing | ||||
| Party | Candidate | Votes | % | ±% | |
|---|---|---|---|---|---|
| SNP | Owen Thompson[6] | 768 | 45.4 | +29.3 | |
| Labour | 311 | 18.4 | −15.4 | ||
| Independent | 268 | 15.8 | +15.8 | ||
| Independent | 217 | 12.8 | +12.8 | ||
| Liberal Democrats | 97 | 5.7 | −5.3 | ||
| Conservative | 13 | 0.8 | −3.8 | ||
| Independent | 9 | 0.5 | +0.5 | ||
| Scottish Green | 8 | 0.5 | +0.5 | ||
| Majority | 457 | 27.0 | |||
| Turnout | 1,691 | ||||
| SNP gain from Independent | Swing | ||||
2012-2017
| Party | Candidate | FPv% | Count | |||||
|---|---|---|---|---|---|---|---|---|
| 1 | 2 | 3 | 4 | 5 | ||||
| Labour | Kenny Young | 32.9 | 1,294 | 1,310 | 1,343 | 1,443 | 1,682 | |
| SNP | Colin Cassidy | 32.1 | 1,260 | 1,270 | 1,357 | 1,384 | 1,613 | |
| Independent | Robert Hogg | 19.8 | 780 | 789 | 831 | 914 | ||
| Conservative | Andrew Hardie | 8.4 | 331 | 342 | 359 | |||
| Scottish Green | Bill Kerr-Smith | 5.0 | 197 | 210 | ||||
| Liberal Democrats | Euan Davidson | 1.7 | 68 | |||||
| Labour hold | ||||||||
| Valid: 3,930 Spoilt: 40 Quota: 1,966 Turnout: 3,970 | ||||||||
| Party | Candidate | FPv% | Count | |||
|---|---|---|---|---|---|---|
| 1 | 2 | 3 | ||||
| SNP | Kelly Parry | 43.2 | 1,540 | 1,558 | 1,701 | |
| Labour | Ian Miller | 26.5 | 945 | 977 | 1,082 | |
| Conservative | Pauline Winchester | 14.7 | 524 | 570 | 618 | |
| Scottish Green | Daya Feldwick | 10.4 | 372 | 420 | ||
| Liberal Democrats | Jane Davidson | 4.5 | 162 | |||
| Independent | David Tedford | 0.7 | 25 | |||
| SNP hold | ||||||
| Valid: 3,568 Spoilt: 49 Quota: 1,785 Turnout: 3,617 | ||||||
2012-2017
| Party | Candidate | FPv% | Count | |||
|---|---|---|---|---|---|---|
| 1 | 2 | 3 | ||||
| SNP | Joe Wallace | 35.0 | 1,663 | 1,803 | 2,237 | |
| Conservative | Murdo MacDonald | 30.2 | 1,433 | 1,469 | 1,788 | |
| Labour | Vivienne Wallace | 27.6 | 1,310 | 1,414 | ||
| Scottish Green | Helen Armstrong | 7.2 | 344 | |||
| Valid: 4,781 Spoilt: 31 Quota: 2,376 Turnout: 4,812 | ||||||
| Party | Candidate | FPv% | Count | ||||
|---|---|---|---|---|---|---|---|
| 1 | 2 | 3 | 4 | ||||
| SNP | Stuart McKenzie | 35.4 | 1,538 | 1,547 | 1,662 | 1,963 | |
| Conservative | Alan Symon | 29.4 | 1,279 | 1,326 | 1,364 | 1,656 | |
| Labour | Hazel Flanagan | 24.6 | 1,070 | 1,114 | 1,222 | ||
| Scottish Green | Joy Godfrey | 6.5 | 282 | 332 | |||
| Liberal Democrats | Margaret Davis | 4.1 | 178 | ||||
| Valid: 4,347 Spoilt: 21 Quota: 2,174 Turnout: 4,368 | |||||||
References
- ↑ "Initial Statutory Reviews of Electoral Arrangements". National Records of Scotland. Retrieved 6 March 2025.
- ↑ "Third Statutory Review of Electoral Arrangements - Midlothian Council Area" (PDF). Local Government Boundary Commission for Scotland. Retrieved 14 March 2025.
- ↑ "Fifth Statutory Review of Electoral Arrangements Final Recommendations - Midlothian Council Area" (PDF). Local Government Boundary Commission for Scotland. Retrieved 24 February 2025.
- ↑ "Local Elections Archive Project — Dalkeith/Woodburn Ward". www.andrewteale.me.uk. Retrieved 14 March 2025.
- ↑ "Local Elections Archive Project — Loanhead Ward". www.andrewteale.me.uk. Retrieved 14 March 2025.
- ↑ "EDM (Early Day Motion) 1023: SCOTTISH NATIONAL PARTY VICTORY IN LOANHEAD BY-ELECTION". UK Parliament. Retrieved 14 March 2025.
- ↑ "Midlothian East by-election". Midlothian Council. 28 November 2014. Archived from the original on 8 January 2015.
- ↑ "Local Elections Archive Project — Midlothian West Ward". www.andrewteale.me.uk. Retrieved 14 March 2025.
- ↑ Scotland, Ballot Box (25 March 2018). "By-Election Results March 2018". Ballot Box Scotland. Retrieved 14 March 2025.
- ↑ "Almond and Earn / Midlothian East By-Election Results". Ballot Box Scotland. 27 March 2021. Retrieved 14 March 2025.