Montmorency Forest
From Wikipedia, the free encyclopedia
| Montmorency Forest French: Fôret Montmorency | |
|---|---|
 Lac Piché | |
| Map | |
 | |
| Geography | |
| Location | Lac-Jacques-Cartier, Capitale-Nationale, Quebec, Canada |
| Coordinates | 47°19′20″N 71°08′50″W / 47.322250°N 71.147111°W |
| Area | 41 200 |
| Administration | |
| Established | 1964 |
| Governing body | Faculty of Forestry and Geomatics from Laval University |
| Website | www |
The Montmorency Forest is an experimental forest located in the unorganized territory of Lac-Jacques-Cartier, in the La Côte-de-Beaupré Regional County Municipality, in the administrative region of Capitale-Nationale, in the province of Quebec, in Canada.
This protected forest is mainly served by the forested route 33 which connects by the south to route 175.[1]
The main lodge located on the west shore of Lac Piché is located 56.7 kilometres (35.2 mi) north of downtown Quebec. This forestry education center is managed by the Faculty of Forestry and Geomatics from Laval University. The university received this territory – starting from an area of 66 square kilometres (25 sq mi) – from Government of Quebec in 1964 by an emphyteutic lease of 99 years. In return, it committed to developing research and teaching in various fields of the natural sciences. In 2014, the Forêt Montmorency benefited from an extension which brought its area to 397 square kilometres (153 sq mi).[2]
Located in the Laurentian Mountains, the Montmorency forest is drained by the Montmorency River and by one of its tributaries, the Black river. There are four lakes: Lac Piché, Bédard, Laflamme and Joncas. The altitude varies between 600 and 1,000 meters (3,300 ft) with an average of 750 meters. The predominant forest stand is the fir forest white birch.
 Piché Lake
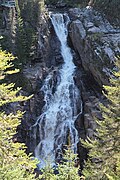 The fall of the Noire river.
 The wooden bridge that spans the Montmorency River
 Reception pavilion


Climate
Annual precipitation exceeds 1,500 millimetres (59 in) and, in winter, the average snowfall exceeds 6 meters. The annual average temperature is 0.5-degree Celsius and there are approximately 133 frost-free days in the year. A weather station existed at 640 metres (2,100 ft) elevation from 1965 to 2001.[3] A new station was established at 672 metres (2,205 ft) beginning in 2003.[4] The weather box uses climate normals from the first station.
| Climate data for Foret Montmorency, Quebec (1991–2020 Normals, extremes 1965–2020) | |||||||||||||
|---|---|---|---|---|---|---|---|---|---|---|---|---|---|
| Month | Jan | Feb | Mar | Apr | May | Jun | Jul | Aug | Sep | Oct | Nov | Dec | Year |
| Record high humidex | 9.6 | 6.3 | 21.9 | 22.6 | 33.1 | 35.0 | 36.5 | 33.5 | 34.8 | 25.8 | 17.4 | 11.9 | 36.5 |
| Record high °C (°F) | 9.5 (49.1) |
12.0 (53.6) |
21.1 (70.0) |
23.5 (74.3) |
29.0 (84.2) |
31.5 (88.7) |
31.0 (87.8) |
33.9 (93.0) |
28.8 (83.8) |
24.4 (75.9) |
16.2 (61.2) |
10.8 (51.4) |
33.9 (93.0) |
| Mean daily maximum °C (°F) | −8.9 (16.0) |
−7.4 (18.7) |
−1.9 (28.6) |
5.1 (41.2) |
13.6 (56.5) |
19.3 (66.7) |
21.2 (70.2) |
20.1 (68.2) |
15.3 (59.5) |
7.9 (46.2) |
0.5 (32.9) |
−5.4 (22.3) |
6.6 (43.9) |
| Daily mean °C (°F) | −15.0 (5.0) |
−14.0 (6.8) |
−8.5 (16.7) |
−0.6 (30.9) |
6.9 (44.4) |
12.5 (54.5) |
14.8 (58.6) |
13.7 (56.7) |
9.4 (48.9) |
3.3 (37.9) |
−4.0 (24.8) |
−10.7 (12.7) |
0.6 (33.1) |
| Mean daily minimum °C (°F) | −21.2 (−6.2) |
−20.6 (−5.1) |
−15.0 (5.0) |
−6.4 (20.5) |
0.1 (32.2) |
5.7 (42.3) |
8.4 (47.1) |
7.3 (45.1) |
3.4 (38.1) |
−1.3 (29.7) |
−8.5 (16.7) |
−15.9 (3.4) |
−5.4 (22.3) |
| Record low °C (°F) | −42.3 (−44.1) |
−41.1 (−42.0) |
−37.2 (−35.0) |
−31.0 (−23.8) |
−17.8 (0.0) |
−6.0 (21.2) |
−2.5 (27.5) |
−3.5 (25.7) |
−10.0 (14.0) |
−21.1 (−6.0) |
−30.0 (−22.0) |
−39.0 (−38.2) |
−42.3 (−44.1) |
| Record low wind chill | −50.4 | −43.4 | −45.5 | −30.5 | −14.2 | −5.3 | 0.0 | −3.5 | −7.9 | −22.1 | −33.5 | −42.6 | −50.4 |
| Average precipitation mm (inches) | 125.5 (4.94) |
103.0 (4.06) |
107.9 (4.25) |
107.5 (4.23) |
107.3 (4.22) |
127.4 (5.02) |
158.1 (6.22) |
125.7 (4.95) |
130.9 (5.15) |
142.3 (5.60) |
141.0 (5.55) |
127.9 (5.04) |
1,504.6 (59.24) |
| Average rainfall mm (inches) | 19.5 (0.77) |
16.5 (0.65) |
29.9 (1.18) |
52.4 (2.06) |
108.3 (4.26) |
137.2 (5.40) |
142.2 (5.60) |
134.8 (5.31) |
126.3 (4.97) |
105.5 (4.15) |
72.7 (2.86) |
18.4 (0.72) |
963.7 (37.94) |
| Average snowfall cm (inches) | 135.3 (53.3) |
100.9 (39.7) |
83.8 (33.0) |
52.3 (20.6) |
7.0 (2.8) |
0.1 (0.0) |
0.0 (0.0) |
0.0 (0.0) |
2.9 (1.1) |
19.7 (7.8) |
89.7 (35.3) |
124.8 (49.1) |
619.9 (244.1) |
| Average precipitation days (≥ 0.2 mm) | 21.2 | 21.0 | 18.8 | 17.5 | 16.9 | 17.0 | 19.1 | 17.3 | 18.4 | 19.9 | 21.3 | 22.4 | 230.6 |
| Average rainy days (≥ 0.2 mm) | 2.3 | 1.5 | 3.7 | 7.9 | 15.1 | 16.8 | 17.8 | 16.7 | 16.7 | 13.3 | 6.8 | 3.1 | 121.6 |
| Average snowy days (≥ 0.2 cm) | 20.4 | 17.7 | 16.2 | 10.8 | 3.0 | 0.2 | 0.1 | 0.0 | 1.7 | 8.1 | 18.0 | 21.1 | 117.2 |
| Mean monthly sunshine hours | 97.0 | 115.5 | 144.4 | 157.3 | 193.2 | 214.6 | 225.1 | 209.6 | 146.1 | 106.4 | 67.8 | 74.5 | 1,751.4 |
| Percentage possible sunshine | 35.0 | 40.0 | 39.2 | 38.6 | 41.3 | 45.1 | 46.8 | 47.5 | 38.6 | 31.5 | 24.1 | 28.1 | 38.0 |
| Source: Environment and Climate Change Canada (rain/snow/sun 1981–2010)[5][6] | |||||||||||||