Municipalities of Puerto Rico
From Wikipedia, the free encyclopedia
The municipalities of Puerto Rico (Spanish: municipios de Puerto Rico) are second-level administrative divisions defined with geographic boundaries and governmental authority in the archipelago and island of Puerto Rico, an unincorporated territory of the U.S. Amounting to 78 incorporated towns and cities equivalent to U.S. counties, two of which are outside the main island, namely the smaller islands of Vieques and Culebra, the municipalities are governed by a popularly elected strong mayor and unicameral legislature. They are subdivided into 902 barrios, third-level divisions controlled by the municipal government.[1][2] As a jurisdiction under U.S. sovereignty, Puerto Rico does not have first-level administrative units akin to states or provinces.
| Municipalities of Puerto Rico municipios de Puerto Rico (Spanish) | |
|---|---|
 Map of Puerto Rico by municipality | |
| Location | Commonwealth of Puerto Rico |
| Number | 78 |
| Populations | From 1,818 pop. in Culebra to 395,326 pop. in San Juan |
| Areas | From 4.84 square miles (12.5 km2) in Cataño to 125.95 square miles (326.2 km2) in Arecibo |
| Government | |
| Subdivisions | |
The municipalities of Puerto Rico operate under the Municipal Code of Puerto Rico (Law No. 107 of 2020), which superseded the Autonomous Municipalities Act of Puerto Rico (Law No. 81 of 1991), as established by the Legislative Assembly of Puerto Rico, the governmental body responsible for their organization under Section 1, Article VI of the Constitution of Puerto Rico.[3] Electorally, the municipalities are grouped into eight senatorial districts and forty representative districts, representing roughly equal populations in the Legislative Assembly.[4][5]
Map
The archipelago and island of Puerto Rico is administratively divided into the following 78 municipalities:
.png)
Municipalities
The archipelago and island of Puerto Rico is administratively divided into the following 78 municipalities (alphabetically ordered):[6]
| Municipalities of Puerto Rico | ||||||||||
|---|---|---|---|---|---|---|---|---|---|---|
| Name | Location | Flag | Coat of Arms | Title | FIPS code[7] |
Population (2020)[8] |
Area[9] | Founded | Barrios | |
| Adjuntas |  |
Town | 72001 | 18,020 | 66.69 sq mi (172.73 sq km) | 1815 | List | |||
| Aguada |  |
Town | 72003 | 38,136 | 30.85 sq mi (79.90 sq km) | 1639 | List | |||
| Aguadilla |  |
City | 72005 | 55,101 | 36.53 sq mi (94.61 sq km) | 1775 | List | |||
| Aguas Buenas |  |
Town | 72007 | 24,223 | 30.08 sq mi (77.92 sq km) | 1838 | List | |||
| Aibonito |  |
Town | 72009 | 24,637 | 31.31 sq mi (81.10 sq km) | 1824 | List | |||
| Añasco |  |
Town | 72011 | 25,596 | 39.29 sq mi (101.75 sq km) | 1733 | List | |||
| Arecibo |  |
City | 72013 | 87,754 | 125.95 sq mi (326.20 sq km) | 1616 | List | |||
| Arroyo |  |
Town | 72015 | 15,843 | 15.01 sq mi (38.87 sq km) | 1855 | List | |||
| Barceloneta |  |
Town | 72017 | 22,657 | 18.69 sq mi (48.41 sq km) | 1881 | List | |||
| Barranquitas |  |
Town | 72019 | 28,983 | 34.25 sq mi (88.71 sq km) | 1803 | List | |||
| Bayamón |  |
City | 72021 | 185,187 | 44.32 sq mi (114.80 sq km) | 1772 | List | |||
| Cabo Rojo |  |
Town | 72023 | 47,158 | 70.37 sq mi (182.27 sq km) | 1771 | List | |||
| Caguas |  |
City | 72025 | 127,244 | 58.60 sq mi (151.77 sq km) | 1775 | List | |||
| Camuy |  |
Town | 72027 | 32,827 | 46.35 sq mi (120.06 sq km) | 1807 | List | |||
| Canóvanas |  |
Town | 72029 | 42,337 | 32.87 sq mi (85.12 sq km) | 1909 | List | |||
| Carolina |  |
City | 72031 | 154,815 | 45.32 sq mi (117.38 sq km) | 1816 | List | |||
| Cataño | Town | 72033 | 23,155 | 4.84 sq mi (12.55 sq km) | 1927 | List | ||||
| Cayey |  |
Town | 72035 | 41,652 | 51.93 sq mi (134.51 sq km) | 1773 | List | |||
| Ceiba |  |
Town | 72037 | 11,307 | 29.04 sq mi (75.20 sq km) | 1838 | List | |||
| Ciales |  |
Town | 72039 | 16,984 | 66.53 sq mi (172.31 sq km) | 1820 | List | |||
| Cidra |  |
Town | 72041 | 39,970 | 36.02 sq mi (93.29 sq km) | 1809 | List | |||
| Coamo |  |
Town | 72043 | 34,668 | 78.10 sq mi (202.27 sq km) | 1579 | List | |||
| Comerío |  |
Town | 72045 | 18,883 | 28.40 sq mi (73.56 sq km) | 1826 | List | |||
| Corozal |  |
Town | 72047 | 34,571 | 42.57 sq mi (110.26 sq km) | 1795 | List | |||
| Culebra |  |
Town | 72049 | 1,792 | 11.62 sq mi (30.10 sq km) | 1880 | List | |||
| Dorado |  |
Town | 72051 | 35,879 | 23.09 sq mi (59.80 sq km) | 1842 | List | |||
| Fajardo | Town | 72053 | 32,124 | 29.86 sq mi (77.34 sq km) | 1772 | List | ||||
| Florida | .svg) |
Town | 72054 | 11,692 | 15.21 sq mi (39.39 sq km) | 1971 | List | |||
| Guánica |  |
Town | 72055 | 13,787 | 37.05 sq mi (95.96 sq km) | 1914 | List | |||
| Guayama |  |
Town | 72057 | 36,614 | 64.99 sq mi (168.32 sq km) | 1736 | List | |||
| Guayanilla |  |
Town | 72059 | 17,784 | 42.27 sq mi (109.48 sq km) | 1833 | List | |||
| Guaynabo |  |
City | 72061 | 89,780 | 27.58 sq mi (71.43 sq km) | 1769 | List | |||
| Gurabo |  |
Town | 72063 | 40,622 | 27.89 sq mi (72.23 sq km) | 1815 | List | |||
| Hatillo |  |
Town | 72065 | 38,486 | 41.78 sq mi (108.21 sq km) | 1823 | List | |||
| Hormigueros |  |
Town | 72067 | 15,654 | 11.34 sq mi (29.37 sq km) | 1874 | List | |||
| Humacao |  |
City | 72069 | 50,896 | 44.75 sq mi (115.90 sq km) | 1722 | List | |||
| Isabela |  |
Town | 72071 | 42,943 | 55.30 sq mi (143.23 sq km) | 1819 | List | |||
| Jayuya |  |
Town | 72073 | 14,779 | 44.53 sq mi (115.33 sq km) | 1911 | List | |||
| Juana Díaz |  |
Town | 72075 | 46,538 | 60.28 sq mi (156.12 sq km) | 1798 | List | |||
| Juncos |  |
Town | 72077 | 37,012 | 26.49 sq mi (68.61 sq km) | 1797 | List | |||
| Lajas |  |
Town | 72079 | 23,334 | 59.95 sq mi (159.15 sq km) | 1883 | List | |||
| Lares |  |
Town | 72081 | 28,105 | 61.45 sq mi (159.15 sq km) | 1827 | List | |||
| Las Marías |  |
Town | 72083 | 8,874 | 46.36 sq mi (120.07 sq km) | 1871 | List | |||
| Las Piedras |  |
Town | 72085 | 35,180 | 33.88 sq mi (87.75 sq km) | 1773 | List | |||
| Loíza |  |
Town | 72087 | 23,693 | 19.37 sq mi (50.17 sq km) | 1719 | List | |||
| Luquillo |  |
Town | 72089 | 17,781 | 25.81 sq mi (66.85 sq km) | 1797 | List | |||
| Manatí |  |
Town | 72091 | 39,492 | 46.13 sq mi (119.48 sq km) | 1738 | List | |||
| Maricao |  |
Town | 72093 | 4,755 | 36.62 sq mi (94.85 sq km) | 1874 | List | |||
| Maunabo |  |
Town | 72095 | 10,589 | 21.07 sq mi (54.57 sq km) | 1799 | List | |||
| Mayagüez |  |
City | 72097 | 73,077 | 77.65 sq mi (201.11 sq km) | 1760 | List | |||
| Moca |  |
Town | 72099 | 37,460 | 50.34 sq mi (130.38 sq km) | 1772 | List | |||
| Morovis |  |
Town | 72101 | 28,727 | 38.87 sq mi (100.67 sq km) | 1818 | List | |||
| Naguabo |  |
Town | 72103 | 23,386 | 51.66 sq mi (133.80 sq km) | 1821 | List | |||
| Naranjito |  |
Town | 72105 | 29,241 | 27.40 sq mi (70.97 sq km) | 1824 | List | |||
| Orocovis | Town | 72107 | 21,434 | 63.62 sq mi (164.78 sq km) | 1825 | List | ||||
| Patillas |  |
Town | 72109 | 15,985 | 46.7 sq mi (120.95 sq km) | 1811 | List | |||
| Peñuelas |  |
Town | 72111 | 20,399 | 44.62 sq mi (115.57 sq km) | 1793 | List | |||
| Ponce |  |
City | 72113 | 137,491 | 114.76 sq mi (297.23 sq km) | 1692 | List | |||
| Quebradillas |  |
Town | 72115 | 23,638 | 22.68 sq mi (58.74 sq km) | 1823 | List | |||
| Rincón | Town | 72117 | 15,187 | 14.29 sq mi (37.01 sq km) | 1771 | List | ||||
| Río Grande |  |
Town | 72119 | 47,060 | 60.62 sq mi (157.01 sq km) | 1840 | List | |||
| Sabana Grande | Town | 72121 | 22,729 | 35.83 sq mi (92.80 sq km) | 1813 | List | ||||
| Salinas |  |
Town | 72123 | 25,789 | 69.37 sq mi (179.67 sq km) | 1851 | List | |||
| San Germán |  |
Town | 72125 | 31,879 | 54.50 sq mi (141.15 sq km) | 1573 | List | |||
| San Juan |  |
City | 72127 | 342,259 | 47.85 sq mi (123.93 sq km) | 1519[10] | List | |||
| San Lorenzo |  |
Town | 72129 | 37,693 | 53.11 sq mi (137.55 sq km) | 1811 | List | |||
| San Sebastián |  |
Town | 72131 | 39,345 | 70.42 sq mi (182.39 sq km) | 1752 | List | |||
| Santa Isabel |  |
Town | 72133 | 20,281 | 34.02 sq mi (88.119 sq km) | 1842 | List | |||
| Toa Alta |  |
City | 72135 | 66,852 | 27.02 sq mi (69.98 sq km) | 1751 | List | |||
| Toa Baja |  |
City | 72137 | 75,293 | 23.24 sq mi (60.19 sq km) | 1745 | List | |||
| Trujillo Alto |  |
City | 72139 | 67,740 | 20.76 sq mi (53.77 sq km) | 1801 | List | |||
| Utuado |  |
Town | 72141 | 28,287 | 113.53 sq mi (294.04 sq km) | 1739 | List | |||
| Vega Alta |  |
Town | 72143 | 35,395 | 27.73 sq mi (71.82 sq km) | 1775 | List | |||
| Vega Baja |  |
City | 72145 | 54,414 | 45.86 sq mi (118.78 sq km) | 1776 | List | |||
| Vieques |  |
Town | 72147 | 8,249 | 50.77 sq mi (131.49 sq km) | 1852 | List | |||
| Villalba | Town | 72149 | 22,093 | 35.64 sq mi (92.31 sq km) | 1917 | List | ||||
| Yabucoa |  |
Town | 72151 | 30,412 | 55.21 sq mi (142.99 sq km) | 1793 | List | |||
| Yauco |  |
Town | 72153 | 34,172 | 68.19 sq mi (176.61 sq km) | 1756 | List | |||
Most populated municipalities
- Municipalities with more than 100,000 inhabitants
 San Juan, the largest municipality and capital of Puerto Rico.
 Bayamón, the second largest municipality of Puerto Rico, located just west of San Juan.
 Carolina, the third largest municipality of Puerto Rico, located just east of San Juan.
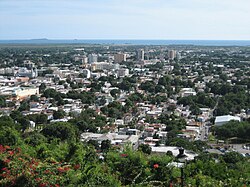 Ponce, the fourth largest municipality of Puerto Rico and the largest municipality outside the San Juan metropolitan area.
 Caguas, the fifth largest municipality of Puerto Rico.


Administration
Since 2020, the municipalities are organized under the Municipal Code of Puerto Rico (Law. No. 107 of 2020).[3] They were previously governed under by the Law of Autonomous Municipalities of Puerto Rico (Law. No. 81 of 1991), which established that every municipality must have an elected strong mayor with a municipal legislature as the form of government.[11] Each legislature must be unicameral, with the number of members related to adequate representation of the total population of the municipality. In contrast to other jurisdictions, both the mayors and the municipal legislators are elected on the same date and for the same term of four years in office.
From a political and ekistic perspective, several differences and similarities exist between municipalities of differing population sizes. For instance, municipalities with 50,000 inhabitants or more are considered incorporated cities, while those with fewer than 50,000 are considered incorporated towns.[12] Size affects the autonomy exercised by the jurisdiction: cities provide and manage their own services, while towns typically depend on nearby cities for certain services. Demographically, municipalities in Puerto Rico are equivalent to counties in the United States, and Puerto Rican municipalities are registered as county subdivisions in the United States census.[13] Statistically, the municipality with the largest number of inhabitants is San Juan, with 342,259, while Culebra is the smallest, with around 1,792. Arecibo is the largest in terms of geography, with around 125 mi2, and Cataño the smallest, with around 4.8 mi2.[8]
Except for San Juan, Ponce, Florida, and Vieques, all municipalities have a barrio equivalent to a downtown area in the U.S. called pueblo, officially known as barrio-pueblo (literally "ward-town"), which typically is the site of the historic Spanish colonial settlement, administrative center, and urban core of the municipality.[14] However, municipalities with large populations, like Ponce, may have an urban core that consist of several barrios.
In Recent Civic Architecture in Porto Rico by Adrian C. Finlayson, architect for the Insular Department of the Interior Architecture, writing for the publication Architectural Record in 1920, the Puerto Rican municipality is accurately described as:
Not merely a city, but something similar to a wide-extending township in New England—like Plymouth, Massachusetts, or Barnstable, on Cape Cod comprising a central town or city with perhaps several outlying districts or barrios, usually rural in character, and occasionally having sizeable concentrated populations in villages, the municipality bearing the name of the central urban portion and all under one local government.
Finances
In 2012, 36 of the 78 municipalities (46%) were experiencing a budget deficit.[16] In total, the combined debt carried by the municipalities stands at about US$590 million.[a]
| Municipality | Mayor's party | Population[18] | Surplus or deficit[19] | Surplus or deficit per capita[19] | Public debt[19] | Public debt per capita[19] | ||||||||
|---|---|---|---|---|---|---|---|---|---|---|---|---|---|---|
| Adjuntas | PNP | 19,483 |
|
|
|
| ||||||||
| Aguada | PPD | 41,959 |
|
|
|
| ||||||||
| Aguadilla | PNP | 60,949 |
|
|
|
| ||||||||
| Aguas Buenas | PPD | 28,659 |
|
|
|
| ||||||||
| Aibonito | PNP | 25,900 |
|
|
|
| ||||||||
| Añasco | PPD | 29,261 |
|
|
|
| ||||||||
| Arecibo | PNP | 96,440 |
|
|
|
| ||||||||
| Arroyo | PPD | 19,575 |
|
|
|
| ||||||||
| Barceloneta | PPD | 24,816 |
|
|
|
| ||||||||
| Barranquitas | PNP | 30,318 |
|
|
|
| ||||||||
| Bayamón | PNP | 208,116 |
|
|
|
| ||||||||
| Cabo Rojo | PPD | 50,917 |
|
|
|
| ||||||||
| Caguas | PPD | 142,893 |
|
|
|
| ||||||||
| Camuy | PNP | 35,159 |
|
|
|
| ||||||||
| Canóvanas | PNP | 47,648 |
|
|
|
| ||||||||
| Carolina | PPD | 176,762 |
|
|
|
| ||||||||
| Cataño | PPD | 28,140 |
|
|
|
| ||||||||
| Cayey | PPD | 48,119 |
|
|
|
| ||||||||
| Ceiba | PNP | 13,631 |
|
|
|
| ||||||||
| Ciales | PPD | 18,782 |
|
|
|
| ||||||||
| Cidra | PNP | 43,480 |
|
|
|
| ||||||||
| Coamo | PPD | 40,512 |
|
|
|
| ||||||||
| Comerío | PPD | 20,778 |
|
|
|
| ||||||||
| Corozal | PPD | 37,142 |
|
|
|
| ||||||||
| Culebra | PPD | 1,818 |
|
|
|
| ||||||||
| Dorado | PPD | 38,165 |
|
|
|
| ||||||||
| Fajardo | PNP | 36,993 |
|
|
|
| ||||||||
| Florida | PNP | 12,680 |
|
|
|
| ||||||||
| Guánica | PNP | 19,427 |
|
|
|
| ||||||||
| Guayama | PPD | 45,362 |
|
|
|
| ||||||||
| Guayanilla | PPD | 21,581 |
|
|
|
| ||||||||
| Guaynabo | PNP | 97,924 |
|
|
|
| ||||||||
| Gurabo | PNP | 45,369 |
|
|
|
| ||||||||
| Hatillo | PPD | 41,953 |
|
|
|
| ||||||||
| Hormigueros | PPD | 17,250 |
|
|
|
| ||||||||
| Humacao | PPD | 58,466 |
|
|
|
| ||||||||
| Isabela | PPD | 45,631 |
|
|
|
| ||||||||
| Jayuya | PPD | 16,642 |
|
|
|
| ||||||||
| Juana Díaz | PPD | 79,897 |
|
|
|
| ||||||||
| Juncos | PPD | 40,290 |
|
|
|
| ||||||||
| Lajas | PPD | 25,753 |
|
|
|
| ||||||||
| Lares | PNP | 30,753 |
|
|
|
| ||||||||
| Las Marías | PPD | 9,881 |
|
|
|
| ||||||||
| Las Piedras | PNP | 38,675 |
|
|
|
| ||||||||
| Loíza | PNP | 30,060 |
|
|
|
| ||||||||
| Luquillo | PPD | 20,068 |
|
|
|
| ||||||||
| Manatí | PNP | 44,113 |
|
|
|
| ||||||||
| Maricao | PNP | 6,276 |
|
|
|
| ||||||||
| Maunabo | PPD | 12,225 |
|
|
|
| ||||||||
| Mayagüez | PPD | 89,080 |
|
|
|
| ||||||||
| Moca | PNP | 40,109 |
|
|
|
| ||||||||
| Morovis | PNP | 32,610 |
|
|
|
| ||||||||
| Naguabo | PNP | 26,720 |
|
|
|
| ||||||||
| Naranjito | PNP | 30,402 |
|
|
|
| ||||||||
| Orocovis | PNP | 23,423 |
|
|
|
| ||||||||
| Patillas | PPD | 19,277 |
|
|
|
| ||||||||
| Peñuelas | PPD | 24,282 |
|
|
|
| ||||||||
| Ponce | PNP | 166,327 |
|
|
|
| ||||||||
| Quebradillas | PPD | 25,919 |
|
|
|
| ||||||||
| Rincón | PPD | 15,200 |
|
|
|
| ||||||||
| Río Grande | PPD | 54,304 |
|
|
|
| ||||||||
| Sabana Grande | PPD | 25,265 |
|
|
|
| ||||||||
| Salinas | PPD | 31,078 |
|
|
|
| ||||||||
| San Germán | PPD | 35,527 |
|
|
|
| ||||||||
| San Juan | PPD | 395,326 |
|
|
|
| ||||||||
| San Lorenzo | PPD | 41,058 |
|
|
|
| ||||||||
| San Sebastián | PNP | 42,430 |
|
|
|
| ||||||||
| Santa Isabel | PNP | 23,274 |
|
|
|
| ||||||||
| Toa Alta | PPD | 74,066 |
|
|
|
| ||||||||
| Toa Baja | PNP | 89,609 |
|
|
|
| ||||||||
| Trujillo Alto | PPD | 74,842 |
|
|
|
| ||||||||
| Utuado | PPD | 33,149 |
|
|
|
| ||||||||
| Vega Alta | PNP | 39,951 |
|
|
|
| ||||||||
| Vega Baja | PPD | 59,662 |
|
|
|
| ||||||||
| Vieques | PPD | 9,301 |
|
|
|
| ||||||||
| Villalba | PPD | 26,073 |
|
|
|
| ||||||||
| Yabucoa | PPD | 37,941 |
|
|
|
| ||||||||
| Yauco | PNP | 42,043 |
|
|
|
|
Racial composition
The following is an alphabetical list of the municipalities and their population together with a breakdown of their racial composition.
| Municipality (2020) | White (both Hispanic and Non-Hispanic)[20][21] | Black (Both Hispanic and Non-Hispanic)[22] | Amerindian (Both Hispanic and Non-Hispanic) | Asian (Both Hispanic and Non-Hispanic) | Two or more races or some other race (Both Hispanic and Non-Hispanic) | Hispanic (Of any Race) |
|---|---|---|---|---|---|---|
| Adjuntas | 22.2 | 3.4 | 4.2 | 0.1 | 65.1 | 99.7 |
| Aguada | 22.7 | 4.1 | 3.0 | 0.2 | 63.5 | 99.3 |
| Aguadilla | 21.0 | 4.1 | 3.5 | 0.2 | 62.9 | 98.4 |
| Aguas Buenas | 14.5 | 7.2 | 3.3 | 0.3 | 61.4 | 99.5 |
| Aibonito | 19.4 | 5.4 | 3.3 | 0.1 | 64.8 | 99.1 |
| Añasco | 18.4 | 5.7 | 3.4 | 0.2 | 63.9 | 99.0 |
| Arecibo | 19.0 | 4.6 | 2.2 | 0.2 | 66.6 | 99.3 |
| Arroyo | 11.5 | 12.5 | 1.9 | 0.4 | 60.4 | 99.1 |
| Barceloneta | 15.8 | 4.1 | 2.4 | 0.2 | 67.4 | 99.5 |
| Barranquitas | 20.8 | 5.2 | 2.1 | 0.1 | 66.2 | 99.7 |
| Bayamón | 17.9 | 6.2 | 3.0 | 0.3 | 62.5 | 99.0 |
| Cabo Rojo | 20.3 | 3.8 | 2.8 | 0.2 | 65.7 | 98.8 |
| Caguas | 15.9 | 6.3 | 3.1 | 0.3 | 63.9 | 99.2 |
| Camuy | 22.7 | 3.8 | 3.0 | 0.1 | 64.2 | 99.1 |
| Canóvanas | 13.4 | 15.1 | 2.6 | 0.3 | 50.3 | 99.3 |
| Carolina | 14.2 | 11.6 | 2.6 | 0.4 | 55.5 | 98.5 |
| Cataño | 13.0 | 8.2 | 2.9 | 0.3 | 62.0 | 99.0 |
| Cayey | 17.4 | 6.3 | 2.5 | 0.2 | 65.3 | 99.4 |
| Ceiba | 16.0 | 9.8 | 2.6 | 0.4 | 57.2 | 98.2 |
| Ciales | 20.8 | 2.9 | 2.1 | 0.3 | 69.6 | 99.5 |
| Cidra | 19.5 | 6.8 | 2.7 | 0.1 | 62.6 | 99.5 |
| Coamo | 20.0 | 7.4 | 2.8 | 0.2 | 61.6 | 99.4 |
| Comerío | 16.9 | 6.4 | 4.1 | 0.2 | 63.3 | 99.6 |
| Corozal | 19.8 | 3.7 | 2.5 | 0.2 | 67.7 | 99.5 |
| Culebra | 17.7 | 8.0 | 1.7 | 1.1 | 51.8 | 89.2 |
| Dorado | 17.6 | 7.5 | 3.1 | 0.6 | 58.1 | 96.6 |
| Fajardo | 14.5 | 9.3 | 2.5 | 0.4 | 61.3 | 98.2 |
| Florida | 13.8 | 2.1 | 1.4 | 0.3 | 74.9 | 99.5 |
| Guánica | 17.1 | 5.2 | 2.7 | 0.2 | 67.2 | 99.1 |
| Guayama | 19.0 | 9.6 | 2.6 | 0.2 | 56.6 | 99.3 |
| Guayanilla | 18.1 | 5.1 | 3.6 | 0.1 | 64.7 | 99.6 |
| Guaynabo | 17.2 | 4.8 | 2.6 | 0.4 | 66.2 | 97.9 |
| Gurabo | 15.2 | 7.1 | 3.3 | 0.2 | 61.8 | 99.2 |
| Hatillo | 21.2 | 3.5 | 2.5 | 0.2 | 66.1 | 99.2 |
| Hormigueros | 18.8 | 5.1 | 2.8 | 0.2 | 65.0 | 99.2 |
| Humacao | 13.5 | 8.8 | 2.5 | 0.3 | 62.4 | 98.0 |
| Isabela | 17.5 | 4.0 | 2.4 | 0.2 | 67.1 | 98.7 |
| Jayuya | 23.3 | 2.4 | 3.3 | 0.1 | 65.8 | 99.5 |
| Juana Díaz | 14.5 | 8.0 | 2.7 | 0.2 | 63.8 | 99.5 |
| Juncos | 13.0 | 9.3 | 2.9 | 0.2 | 61.0 | 99.4 |
| Lajas | 18.9 | 4.1 | 2.6 | 0.2 | 67.4 | 99.3 |
| Lares | 20.5 | 2.2 | 2.5 | 0.1 | 70.1 | 99.3 |
| Las Marías | 17.2 | 3.5 | 3.1 | 0.3 | 69.4 | 99.2 |
| Las Piedras | 15.6 | 8.3 | 2.9 | 0.2 | 60.3 | 99.4 |
| Loíza | 5.8 | 31.8 | 1.6 | 0.2 | 27.7 | 99.4 |
| Luquillo | 17.2 | 12.1 | 2.7 | 0.3 | 54.1 | 97.1 |
| Manatí | 17.1 | 4.3 | 2.2 | 0.2 | 67.8 | 99.3 |
| Maricao | 22.2 | 7.8 | 3.7 | 0.5 | 61.0 | 99.5 |
| Maunabo | 9.1 | 16.7 | 2.0 | 0.2 | 56.0 | 99.4 |
| Mayagüez | 19.7 | 4.6 | 3.0 | 0.3 | 63.2 | 98.7 |
| Moca | 17.0 | 3.1 | 2.6 | 0.1 | 70.8 | 99.6 |
| Morovis | 19.1 | 3.4 | 2.5 | 0.2 | 69.4 | 99.6 |
| Naguabo | 13.3 | 9.2 | 2.4 | 0.2 | 63.2 | 99.2 |
| Naranjito | 20.7 | 6.4 | 3.3 | 0.2 | 61.0 | 99.6 |
| Orocovis | 16.3 | 5.3 | 6.4 | 0.2 | 62.6 | 99.6 |
| Patillas | 15.9 | 12.3 | 2.6 | 0.2 | 57.2 | 99.3 |
| Peñuelas | 23.1 | 6.7 | 3.8 | 0.1 | 57.2 | 99.5 |
| Ponce | 19.0 | 4.9 | 3.0 | 0.3 | 64.4 | 99.1 |
| Quebradillas | 25.4 | 3.4 | 3.2 | 0.2 | 62.6 | 99.2 |
| Rincón | 21.4 | 5.9 | 4.9 | 0.2 | 58.5 | 94.9 |
| Río Grande | 14.7 | 14.7 | 2.6 | 0.3 | 50.4 | 98.8 |
| Sabana Grande | 19.9 | 4.0 | 2.4 | 0.2 | 66.6 | 99.4 |
| Salinas | 16.3 | 9.8 | 3.8 | 0.2 | 57.6 | 99.2 |
| San Germán | 18.5 | 4.6 | 3.8 | 0.3 | 64.1 | 99.2 |
| San Juan | 14.4 | 8.2 | 2.7 | 0.5 | 60.2 | 97.8 |
| San Lorenzo | 14.0 | 6.6 | 2.7 | 0.2 | 66.0 | 99.5 |
| San Sebastián | 19.2 | 2.1 | 2.9 | 0.1 | 70.4 | 99.4 |
| Santa Isabel | 15.7 | 8.2 | 2.6 | 0.2 | 60.8 | 99.4 |
| Toa Alta | 16.2 | 5.8 | 2.7 | 0.2 | 65.8 | 99.4 |
| Toa Baja | 16.3 | 10.1 | 2.2 | 0.3 | 59.1 | 99.0 |
| Trujillo Alto | 14.2 | 8.0 | 2.3 | 0.2 | 62.6 | 99.1 |
| Utuado | 21.6 | 2.4 | 4.0 | 0.2 | 66.3 | 99.2 |
| Vega Alta | 12.4 | 7.3 | 2.4 | 0.3 | 66.6 | 98.8 |
| Vega Baja | 18.5 | 6.4 | 3.5 | 0.2 | 61.2 | 99.3 |
| Vieques | 18.8 | 15.2 | 2.6 | 0.4 | 52.2 | 92.0 |
| Villalba | 15.5 | 6.2 | 2.9 | 0.2 | 65.4 | 99.6 |
| Yabucoa | 16.5 | 9.7 | 2.6 | 0.2 | 60.6 | 99.4 |
| Yauco | 21.4 | 4.7 | 3.2 | 0.2 | 63.5 | 99.4 |
| Puerto Rico | 17.1 | 7.0 | 2.8 | 0.3 | 62.3 | 98.9 |
Proposed amalgamation
Multiple times, politicians have discussed and proposed consolidating Puerto Rico's municipalities but so far no proposals has been adopted. In 1902 the Puerto Rico legislature, under pressure from the U.S.-appointed governor of Puerto Rico, passed a law consolidating the then-76 municipalities of Puerto Rico into 46.[23] The law was repealed three years later.[24][25] In October 2009, a Puerto Rican legislator proposed a bill that would reduce the current 78 municipalities of Puerto Rico down to 20. The bill called for a referendum to take place on June 13, 2010, which would let the people decide on the matter.[26] However, the bill never made into law.[27] With the Puerto Rican government-debt crisis that emerged in the first half of 2010s, a new plan to consolidate municipalities was again circulated in the legislature in 2017 as a way to alleviate the government debt crisis.[28][29] In March 2019, then Governor Ricardo Rosselló created an initiative that would preserve the existing municipalities but create regional consolidation by sharing service overhead in the form of counties but he resigned prior to anything coming of his proposal.[30]