Newcastle City Council elections
Local government elections in Newcastle upon Tyne, England
From Wikipedia, the free encyclopedia
Newcastle City Council elections are generally held three years out of every four, with a third of the council being elected each time. Newcastle City Council is the local authority for the metropolitan borough of the Newcastle upon Tyne in Tyne and Wear, England. Since the last boundary changes in 2018, 78 councillors have been elected from 26 wards.[1]
Council elections
- 1998 Newcastle City Council election
- 1999 Newcastle City Council election
- 2000 Newcastle City Council election
- 2002 Newcastle City Council election
- 2003 Newcastle City Council election
- 2004 Newcastle City Council election (whole council elected after boundary changes)[2]
- 2006 Newcastle City Council election
- 2007 Newcastle City Council election
- 2008 Newcastle City Council election
- 2010 Newcastle City Council election
- 2011 Newcastle City Council election
- 2012 Newcastle City Council election
- 2014 Newcastle City Council election
- 2015 Newcastle City Council election
- 2016 Newcastle City Council election
- 2018 Newcastle City Council election (whole council elected after boundary changes)
- 2019 Newcastle City Council election
- 2021 Newcastle City Council election
- 2022 Newcastle City Council election
- 2023 Newcastle City Council election
- 2024 Newcastle City Council election
- 2026 Newcastle City Council election (whole council elected after boundary changes)
City result maps
 2004 results map
 2006 results map
 2007 results map
 2008 results map
 2010 results map
 2011 results map
 2012 results map
 2014 results map
 2015 results map
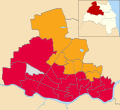 2016 results map
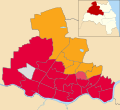 2018 results map
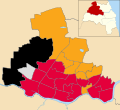 2019 results map
 2021 results map
 2022 results map
 2023 results map
 2024 results map
 2026 results map


By-election results
1994-1998
| Party | Candidate | Votes | % | ±% | |
|---|---|---|---|---|---|
| Labour | Lilian Mary Kennedy | 2,630 | 68.1 | −7.2 | |
| Conservative | Colin Forster | 657 | 17.0 | +5.2 | |
| Liberal Democrats | Robert Ernest Walker | 576 | 14.9 | +1.9 | |
| Majority | 1,973 | 51.1 | |||
| Turnout | 3,863 | 65.8 | |||
| Labour hold | Swing | ||||
| Party | Candidate | Votes | % | ±% | |
|---|---|---|---|---|---|
| Liberal Democrats | Thomas David George Woodwark | 1,474 | 43.7 | −15.0 | |
| Conservative | Marie Summersby | 1,096 | 32.5 | +1.3 | |
| Labour | Susan Jane MacDonald Stirling | 800 | 23.7 | +13.6 | |
| Majority | 378 | 11.2 | |||
| Turnout | 3,370 | ||||
| Liberal Democrats hold | Swing | ||||
| Party | Candidate | Votes | % | ±% | |
|---|---|---|---|---|---|
| Labour | Doreen James | 468 | 81.5 | +2.0 | |
| Liberal Democrats | Phillip George Lower | 74 | 12.9 | +5.9 | |
| Conservative | Timothy David Troman | 32 | 5.6 | −3.2 | |
| Majority | 394 | 68.6 | |||
| Turnout | 574 | 10.3 | |||
| Labour hold | Swing | ||||
| Party | Candidate | Votes | % | ±% | |
|---|---|---|---|---|---|
| Labour | Colin Wappat | 564 | 52.9 | −10.7 | |
| Conservative | Jeremy Peter Middleton | 211 | 19.8 | +6.0 | |
| Liberal Democrats | Neil John Bradbury | 158 | 14.8 | +4.5 | |
| Green | Christopher Patrick Hayday | 84 | 7.9 | +1.9 | |
| Communist | Martin Richard Levy | 50 | 4.7 | +4.7 | |
| Majority | 353 | 33.1 | |||
| Turnout | 1,067 | 11.5 | |||
| Labour hold | Swing | ||||
1998-2002
| Party | Candidate | Votes | % | ±% | |
|---|---|---|---|---|---|
| Liberal Democrats | Gregory Martin Stone | 1,961 | 58.1 | +2.6 | |
| Labour | John Lawrence Young | 1,061 | 31.4 | +0.6 | |
| Conservative | Alice Gingell | 353 | 10.5 | −3.2 | |
| Majority | 900 | 26.7 | |||
| Turnout | 3,375 | 29.5 | |||
| Liberal Democrats gain from Labour | Swing | ||||
| Party | Candidate | Votes | % | ±% | |
|---|---|---|---|---|---|
| Labour | Michelle Pike | 366 | 56.8 | −18.8 | |
| Liberal Democrats | Thomas James Thompson | 206 | 32.0 | +13.1 | |
| Green | Pamela Jane Woolner | 37 | 5.7 | +5.7 | |
| Conservative | Jeremy Peter Middleton | 35 | 5.4 | −0.1 | |
| Majority | 160 | 24.8 | |||
| Turnout | 644 | 9.7 | |||
| Labour hold | Swing | ||||
| Party | Candidate | Votes | % | ±% | |
|---|---|---|---|---|---|
| Labour | Hazel Stephenson | 490 | 66.9 | −16.5 | |
| Liberal Democrats | Susan Anne Reilly | 180 | 24.6 | +16.0 | |
| Conservative | Peter Lumley | 62 | 8.5 | +0.4 | |
| Majority | 310 | 42.3 | |||
| Turnout | 732 | 14.9 | |||
| Labour hold | Swing | ||||
| Party | Candidate | Votes | % | ±% | |
|---|---|---|---|---|---|
| Liberal Democrats | Elizabeth Dicken | 2,496 | 46.0 | +6.5 | |
| Labour | Fiona Karen Clarke | 1,659 | 30.5 | −1.3 | |
| Conservative | Jonjo McNamara | 1,116 | 20.5 | −1.5 | |
| Independent | Marie Summersby | 160 | 2.9 | +2.9 | |
| Majority | 837 | 15.5 | |||
| Turnout | 5,431 | ||||
| Liberal Democrats gain from Labour | Swing | ||||
| Party | Candidate | Votes | % | ±% | |
|---|---|---|---|---|---|
| Labour | John Stokel-Walker | 2,672 | 58.3 | +4.0 | |
| Liberal Democrats | Belinda Knowles | 1,606 | 35.0 | −4.7 | |
| Conservative | Keith Gilfillan | 306 | 6.7 | +0.6 | |
| Majority | 1,066 | 23.3 | |||
| Turnout | 4,584 | ||||
| Labour hold | Swing | ||||
2002-2006
| Party | Candidate | Votes | % | ±% | |
|---|---|---|---|---|---|
| Labour | Eric Mackinlay | 700 | 55.8 | −3.0 | |
| Liberal Democrats | Brian Moore | 383 | 30.5 | +13.6 | |
| Conservative | Carolyn Smith | 136 | 10.8 | +0.0 | |
| Green | Jesus Miguel-Garcia | 36 | 2.9 | −1.4 | |
| Majority | 317 | 25.3 | |||
| Turnout | 1,255 | 24.3 | |||
| Labour hold | Swing | ||||
| Party | Candidate | Votes | % | ±% | |
|---|---|---|---|---|---|
| Labour | John Stokel-Walker | 1,440 | 62.1 | −12.3 | |
| BNP | Jonathan Keys | 395 | 17.1 | +17.1 | |
| Liberal Democrats | John McLennan | 370 | 16.0 | −0.4 | |
| Conservative | Joseph Prince | 112 | 4.8 | −1.7 | |
| Majority | 1,045 | 45.0 | |||
| Turnout | 2,317 | 47.7 | |||
| Labour hold | Swing | ||||
2006-2010
| Party | Candidate | Votes | % | ±% | |
|---|---|---|---|---|---|
| Liberal Democrats | Lawrence Hunter | 1,180 | 46.7 | −9.3 | |
| Labour | Ruth Robson | 815 | 32.2 | −11.8 | |
| BNP | Kenneth Booth | 383 | 15.2 | +15.2 | |
| Conservative | Jason Smith | 147 | 5.8 | +5.8 | |
| Majority | 365 | 14.5 | |||
| Turnout | 2,525 | 34.1 | |||
| Liberal Democrats gain from Labour | Swing | ||||
| Party | Candidate | Votes | % | ±% | |
|---|---|---|---|---|---|
| Labour | Nigel Todd | 1,051 | |||
| Liberal Democrats | Ayaz Siddique | 948 | |||
| Labour | Alyson Hampshire | 908 | |||
| Liberal Democrats | Deborah Wilkinson | 869 | |||
| Green | Jenny Pearson | 186 | |||
| Green | John Pearson | 183 | |||
| Conservative | Neil Archibald | 173 | |||
| Conservative | Alexander Le Vey | 140 | |||
| BNP | Viv Browne | 81 | |||
| BNP | Graham Hodgson | 80 | |||
| Turnout | 4,619 | 31.2 | |||
| Labour hold | Swing | ||||
| Liberal Democrats hold | Swing | ||||
| Party | Candidate | Votes | % | ±% | |
|---|---|---|---|---|---|
| Liberal Democrats | Mitzi Emery | 1,049 | 33.9 | −11.8 | |
| Labour | Helen McStravick | 1,025 | 33.1 | −3.3 | |
| BNP | Ken Booth | 836 | 27.0 | +18.0 | |
| Conservative | Sarah Armstrong | 186 | 6.0 | −2.9 | |
| Majority | 24 | 0.8 | |||
| Turnout | 3,096 | 39.6 | |||
| Liberal Democrats gain from Labour | Swing | ||||
2010-2014
| Party | Candidate | Votes | % | ±% | |
|---|---|---|---|---|---|
| Labour | Stephen Powers | 714 | 47.6% | +11.7% | |
| Liberal Democrats | Mark Nelson | 665 | 44.3% | −6.3% | |
| Newcastle First | Ian Fraser | 73 | 4.9% | +4.9% | |
| Conservative | Joshua Chew | 49 | 3.3% | −0.7% | |
| Majority | 49 | 3.3% | |||
| Labour hold | Swing | ||||
| Party | Candidate | Votes | % | ±% | |
|---|---|---|---|---|---|
| Liberal Democrats | Phillip Lower | 1,165 | 43.7%% | −6.2% | |
| Labour | Ben Riley | 1,043 | 39.2% | +4.7% | |
| Newcastle First | John Gordon | 215 | 8.1% | +0.1% | |
| Conservative | Jennifer Nixon | 194 | 7.3% | −0.3% | |
| TUSC | Rory Jobe | 48 | 1.8% | +1.8% | |
| Majority | 122 | 4.5% | |||
| Liberal Democrats hold | Swing | ||||
| Party | Candidate | Votes | % | ±% | |
|---|---|---|---|---|---|
| Labour | Denise Jones | 798 | 61.2% | −8.2% | |
| Green | Andrew Grey | 205 | 15.7% | +3.4% | |
| Liberal Democrats | Rachel Auld | 114 | 8.7% | −0.5% | |
| TUSC | Paul Phillips | 69 | 5.3% | +1.0% | |
| Conservative | Katie Bennett | 52 | 4.0% | −0.7% | |
| Newcastle First | Timothy Gilks | 44 | 3.4% | +3.4% | |
| Independent | Reg Sibley | 22 | 1.7% | +1.7% | |
| Majority | 593 | ||||
| Labour hold | Swing | ||||
| Party | Candidate | Votes | % | ±% | |
|---|---|---|---|---|---|
| Labour | Stephen Wood | 1,080 | 44.0% | −24.1% | |
| UKIP | Lorraine Smith | 668 | 27.2% | +27.2% | |
| Liberal Democrats | Kevin Brown | 460 | 18.8% | −4.2% | |
| Independent | Davy Hicks | 64 | 2.6% | +2.6% | |
| Newcastle First | Olga Shorton | 61 | 2.5% | +2.5% | |
| Conservative | Marian McWilliams | 54 | 2.2% | −3.1% | |
| Green | Martin Collins | 30 | 1.2% | +1.2% | |
| TUSC | Bobbie Cranney | 24 | 1.0% | +1.0% | |
| Independent | Reg Sibley | 12 | 0.5% | +0.5% | |
| Majority | 412 | 16.8% | |||
| Turnout | 2,453 | ||||
| Labour hold | Swing | ||||
2014-2018
| Party | Candidate | Votes | % | ±% | |
|---|---|---|---|---|---|
| Liberal Democrats | Gerry Keating | 711 | 52.5% | +19.9% | |
| Labour | Peter Smith | 320 | 23.6% | −7.3% | |
| Conservative | Duncan Crute | 117 | 8.6% | −5.9% | |
| UKIP | Daniel Thompson | 112 | 8.3% | +0.7% | |
| Green | Shehla Naqvi | 94 | 6.9% | −7.6% | |
| Majority | 391 | 28.9% | 13.6% | ||
| Liberal Democrats hold | Swing | ||||
| Party | Candidate | Votes | % | ±% | |
|---|---|---|---|---|---|
| Labour | Nora Casey | 1,004 | 41.9% | −21.3% | |
| Liberal Democrats | Ciaran Morrissey | 654 | 27.3% | +18.2% | |
| UKIP | Ritchie Lane | 443 | 18.5% | +2.4% | |
| Conservative | James Langley | 190 | 7.9% | +0.3% | |
| Green | Brendan Derham | 105 | 4.4% | +0.4% | |
| Majority | 350 | 14.6% | |||
| Labour hold | Swing | ||||
| Party | Candidate | Votes | % | ±% | |
|---|---|---|---|---|---|
| Labour | Oskar Andrew Avery | 892 | 44.9% | −25.7% | |
| Liberal Democrats | Ciaran Joseph Morrissey | 784 | 39.4% | +21.4% | |
| Newcastle First | John Alan Gordon | 164 | 8.2% | +8.2% | |
| Conservative | James Gerard Langley | 148 | 7.4% | −4.0% | |
| Majority | 108 | 5.5% | |||
| Labour hold | Swing | ||||
| Party | Candidate | Votes | % | ±% | |
|---|---|---|---|---|---|
| Labour | Clare Penny-Evans | 768 | 46.8% | −5.4% | |
| Green | Andrew Gray | 444 | 27.1% | +2.4% | |
| Liberal Democrats | Chris Boyle | 260 | 15.0% | +9.7% | |
| UKIP | Tony Sanderson | 88 | 5.4% | −4.6% | |
| Conservative | Chris Murray | 80 | 4.9% | +0.2% | |
| Majority | 329 | 19.7% | |||
| Labour hold | Swing | ||||
2018-2022
| Party | Candidate | Votes | % | ±% | |
|---|---|---|---|---|---|
| Liberal Democrats | Thom Campion | 1,306 | 42.5 | ||
| Labour | Andrew Herridge | 773 | 25.1 | ||
| Conservative | John Watts | 657 | 21.4 | ||
| Green | Andrew Thorp | 250 | 8.1 | ||
| North East | Brian Moore | 89 | 2.9 | ||
| Majority | 533 | 17.3 | |||
| Liberal Democrats hold | Swing | ||||
2022-2026
| Party | Candidate | Votes | % | ±% | |
|---|---|---|---|---|---|
| Labour | Hayder Qureshi | 591 | 46.9 | −18.1 | |
| Green | Nick Hartley | 375 | 29.7 | +15.3 | |
| Liberal Democrats | Mark Ridyard | 188 | 14.9 | +9.2 | |
| Conservative | Aaron Whelan Harvey | 107 | 8.5 | −6.5 | |
| Majority | 216 | 17.1 | |||
| Turnout | 1,261 | ||||
| Labour hold | Swing | ||||
| Party | Candidate | Votes | % | ±% | |
|---|---|---|---|---|---|
| Liberal Democrats | Peter Allen | 740 | 64.5 | +16.4 | |
| Labour | Callum Buchanan | 234 | 46.9 | −18.1 | |
| Green | Shehla Naqvi | 93 | 8.1 | −4.6 | |
| Conservative | Stephen Dawes | 35 | 3.1 | −3.0 | |
| Reform | Anas el-Hamri | 26 | 2.3 | +2.3 | |
| Party of Women | Liz Panton | 19 | 1.7 | +1.7 | |
| Majority | 506 | 44.1 | |||
| Turnout | 1,147 | ||||
| Liberal Democrats hold | Swing | ||||
| Party | Candidate | Votes | % | ±% | |
|---|---|---|---|---|---|
| Green | Sarah Peters | 578 | 36.4 | +15.2 | |
| Liberal Democrats | June Browne | 523 | 33.0 | +7.3 | |
| Labour | Owen Bell | 267 | 16.8 | −25.3 | |
| Reform | Gavin Maw | 173 | 10.9 | +10.9 | |
| Conservative | Stephen Dawes | 45 | 2.8 | −5.7 | |
| Majority | 55 | 3.4 | |||
| Turnout | 1,586 | 30.8 | |||
| Green gain from Labour | Swing | ||||