North Lincolnshire Council elections
Local government elections in Lincolnshire, England
From Wikipedia, the free encyclopedia
North Lincolnshire Council is the local authority for the unitary authority of North Lincolnshire in Lincolnshire, England. It was created on 1 April 1996 replacing Glanford, Scunthorpe, part of Boothferry and Humberside County Council.
Council elections
- 1995 North Lincolnshire Council election
- 1999 North Lincolnshire Council election
- 2003 North Lincolnshire Council election (New ward boundaries)[1]
- 2007 North Lincolnshire Council election
- 2011 North Lincolnshire Council election
- 2015 North Lincolnshire Council election
- 2019 North Lincolnshire Council election
- 2023 North Lincolnshire Council election (New ward boundaries)[2]
Election results
| Overall control | Conservative | Labour | Lib Dems | Independent | |||||
| 2023 | Conservative | 27 | 16 | 0 | 0 | ||||
| 2019 | Conservative | 27 | 16 | 0 | 0 | ||||
| 2015 | Conservative | 26 | 17 | 0 | 0 | ||||
| 2011 | Conservative | 23 | 20 | 0 | 0 | ||||
| 2007 | Labour | 19 | 22 | 1 | 1 | ||||
| 2003 | Conservative | 22 | 21 | 0 | 0 | ||||
District result maps
 2003 results map
 2007 results map
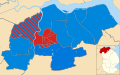 2011 results map
 2015 results map
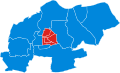 2019 results map
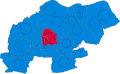 2023 results map


By-election results
1995–1999
| Party | Candidate | Votes | % | ±% | |
|---|---|---|---|---|---|
| Labour | 889 | 72.4 | −11.7 | ||
| Conservative | 252 | 20.5 | +4.6 | ||
| Liberal Democrats | 87 | 7.1 | +7.1 | ||
| Majority | 637 | 51.9 | |||
| Turnout | 1,228 | 15.6 | |||
| Labour hold | Swing | ||||
1999–2003
| Party | Candidate | Votes | % | ±% | |
|---|---|---|---|---|---|
| Conservative | Tracy Muir | 854 | 52.0 | −0.7 | |
| Labour | David Oldfield | 631 | 38.5 | −8.8 | |
| Independent | Frank Bottamley | 156 | 9.5 | +9.5 | |
| Majority | 223 | 13.5 | |||
| Turnout | 1,641 | 31.5 | |||
| Conservative hold | Swing | ||||
2003–2007
| Party | Candidate | Votes | % | ±% | |
|---|---|---|---|---|---|
| Conservative | Ivan Glover | 891 | 49.1 | +0.9 | |
| Labour | Ken Edgell | 790 | 43.6 | +2.3 | |
| Liberal Democrats | Val Margetts | 132 | 7.3 | −3.2 | |
| Majority | 101 | 5.5 | |||
| Turnout | 1,813 | 35.6 | |||
| Conservative hold | Swing | ||||
| Party | Candidate | Votes | % | ±% | |
|---|---|---|---|---|---|
| Labour | Christine O'Sullivan | 1,044 | 54.9 | −4.4 | |
| Liberal Democrats | Neil Poole | 414 | 21.8 | +8.8 | |
| Conservative | Michael Sykes | 258 | 13.5 | −1.1 | |
| BNP | Robert Bailey | 186 | 9.8 | +9.8 | |
| Majority | 630 | 33.1 | |||
| Turnout | 1,902 | 22.6 | |||
| Labour hold | Swing | ||||
| Party | Candidate | Votes | % | ±% | |
|---|---|---|---|---|---|
| Labour | Michael Collinson | 1,151 | 68.0 | +14.7 | |
| Conservative | Alec Readhead | 328 | 19.4 | −5.8 | |
| Liberal Democrats | John Thompson | 213 | 12.6 | −8.9 | |
| Majority | 823 | 48.6 | |||
| Turnout | 1,692 | 23.2 | |||
| Labour hold | Swing | ||||
| Party | Candidate | Votes | % | ±% | |
|---|---|---|---|---|---|
| Labour | Leonard Foster | 796 | 66.5 | +6.3 | |
| Conservative | Lawrence Chapman | 249 | 20.8 | −1.3 | |
| Liberal Democrats | Adrian Holmes | 152 | 12.7 | −5.0 | |
| Majority | 547 | 45.7 | |||
| Turnout | 1,197 | 14.3 | |||
| Labour hold | Swing | ||||
| Party | Candidate | Votes | % | ±% | |
|---|---|---|---|---|---|
| Conservative | Trevor Foster | 1,154 | 37.4 | −13.3 | |
| Liberal Democrats | Neil Poole | 1,102 | 35.7 | +9.1 | |
| Labour | Alan May | 656 | 21.3 | −1.5 | |
| Independent | Andrew Talliss | 175 | 5.7 | +5.7 | |
| Majority | 52 | 1.7 | |||
| Turnout | 3,087 | 31.5 | |||
| Conservative hold | Swing | ||||
2007–2011
| Party | Candidate | Votes | % | ±% | |
|---|---|---|---|---|---|
| Conservative | Paul Vickers | 1,576 | 64.35 | −0.52 | |
| Labour | Sue Turner | 653 | 26.66 | +6.18 | |
| Liberal Democrats | Richard Alan Nixon | 220 | 8.98 | +1.93 | |
| Majority | 873 | 35.65 | |||
| Turnout | 2,449 | ||||
| Conservative hold | Swing | ||||
2011–2015
2015–2019
| Party | Candidate | Votes | % | ±% | |
|---|---|---|---|---|---|
| Labour | Stephen Swift | 2,428 | 56.5 | +3.2 | |
| Conservative | Janet Longcake | 1,356 | 31.5 | +31.5 | |
| UKIP | Dave Carswell | 270 | 6.3 | −28.7 | |
| Independent | Paul Elsom | 177 | 4.1 | +4.1 | |
| Independent | Graham Wagstaffe | 70 | 1.6 | +1.6 | |
| Majority | 1,072 | 24.9 | |||
| Turnout | 4,301 | ||||
| Labour hold | Swing | ||||
2019–2023
| Party | Candidate | Votes | % | ±% | |
|---|---|---|---|---|---|
| Conservative | Joanne Saunby | 1,137 | 50.8 | +19.1 | |
| Labour | Christopher Skinner | 980 | 43.8 | −24.5 | |
| Green | Peter Dennington | 119 | 5.3 | +5.3 | |
| Majority | 157 | 7.0 | |||
| Turnout | 2,236 | ||||
| Conservative gain from Labour | Swing | ||||
| Party | Candidate | Votes | % | ±% | |
|---|---|---|---|---|---|
| Conservative | Janet Longcake | 2,084 | 73.3 | +16.5 | |
| Labour | Glyn Williams | 1,088 | 26.7 | −16.5 | |
| Majority | 1,896 | 46.6 | |||
| Turnout | 4,072 | ||||
| Conservative hold | Swing | ||||
| Party | Candidate | Votes | % | ±% | |
|---|---|---|---|---|---|
| Conservative | Carol Ross | 1,217 | |||
| Conservative | Janet Lee | 1,141 | |||
| Labour | Graham Ladlow | 412 | |||
| Labour | Lucy Watson | 450 | |||
| Green | Jo Baker | 99 | |||
| Green | Amie Watson | 82 | |||
| For Britain | Mike Speakman | 34 | |||
| Turnout | 3353 | ||||
| Conservative hold | Swing | ||||
| Conservative hold | Swing | ||||
2023–2027
| Party | Candidate | Votes | % | ±% | |
|---|---|---|---|---|---|
| Conservative | Ian Bint | 901 | 66.9 | +8.7 | |
| Labour | Lara Chaplin | 378 | 28.1 | −3.9 | |
| Liberal Democrats | Alan Kelly | 67 | 5.0 | +5.0 | |
| Majority | 523 | 38.9 | |||
| Turnout | 1,346 | ||||
| Conservative hold | Swing | ||||
| Party | Candidate | Votes | % | ±% | |
|---|---|---|---|---|---|
| Labour | Daniel Hart | 616 | 61.5 | −9.9 | |
| Conservative | Alan Cook | 294 | 29.3 | +0.7 | |
| Green | Peter Dennington | 49 | 4.9 | +4.9 | |
| Liberal Democrats | Robin Abram | 43 | 4.3 | +4.3 | |
| Majority | 322 | 32.1 | |||
| Turnout | 1,002 | ||||
| Labour hold | Swing | ||||
| Party | Candidate | Votes | % | ±% | |
|---|---|---|---|---|---|
| Conservative | Caroline Finch | 925 | 49.2 | −19.6 | |
| Reform | Gerrad Farmer | 668 | 35.5 | +35.5 | |
| Green | Alex Ellis | 157 | 8.3 | +8.3 | |
| Labour | Matthew Rawcliffe | 103 | 5.5 | −25.7 | |
| Liberal Democrats | Michael Shaw | 28 | 1.5 | +1.5 | |
| Majority | 257 | 13.7 | |||
| Turnout | 1,881 | ||||
| Conservative hold | Swing | ||||
| Party | Candidate | Votes | % | ±% | |
|---|---|---|---|---|---|
| Reform | Ellen Dew | 769 | 52.3 | +52.3 | |
| Labour | Thomas Smith | 410 | 27.9 | −43.5 | |
| Green | Sam Hewson | 133 | 9.1 | +9.1 | |
| Conservative | Joanne Saunby | 110 | 7.5 | −21.1 | |
| Liberal Democrats | Alan Kelly | 47 | 3.2 | +3.2 | |
| Majority | 359 | 24.4 | |||
| Turnout | 1,469 | ||||
| Reform gain from Labour | Swing | ||||