Perth and Kinross Council elections
From Wikipedia, the free encyclopedia
Local government elections in Perth and Kinross, Scotland
Perth and Kinross Council in Scotland holds elections every five years, previously holding them every four years from its creation as a single-tier authority in 1995 to 2007.
As a district council
| Year | SNP | Conservative | Liberal[a] | Labour | Independent |
|---|---|---|---|---|---|
| 1974 | 0 | 16 | 0 | 4 | 9 |
| 1977 | 2 | 19 | 0 | 3 | 5 |
| 1980 | 1 | 19 | 1 | 5 | 3 |
| 1984[b] | 1 | 14 | 4 | 6 | 4 |
| 1988 | 8 | 12 | 2 | 5 | 2 |
| 1992 | 5 | 16 | 2 | 3 | 3 |
- ↑ SDP–Liberal Alliance in 1984, Liberal Democrats from 1988 onwards.
- ↑ New ward boundaries.[1]
As a unitary authority
| Year | SNP | Conservative | Liberal Democrats | Labour | Perth Independent Candidates Party | Independent |
|---|---|---|---|---|---|---|
| 1995 | 18 | 2 | 5 | 6 | 0 | 1 |
| 1999[a] | 15 | 11 | 6 | 6 | 0 | 3 |
| 2003 | 15 | 10 | 9 | 5 | 0 | 2 |
| 2007[b] | 18 | 12 | 8 | 3 | 0 | 0 |
| 2012 | 18 | 10 | 5 | 4 | 1 | 3 |
| 2017[c] | 15 | 17 | 4 | 1 | 0 | 3 |
| 2022 | 16 | 14 | 4 | 2 | 0 | 4 |
Results maps
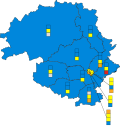 2017 results map

By-elections
2007-2012
| Party | Candidate | FPv% | Count | |
|---|---|---|---|---|
| 1 | ||||
| SNP | Katie Howie | 59.9 | 1,891 | |
| Conservative | Graham Rees | 29.8 | 940 | |
| Liberal Democrats | Andrew Kenton | 7.3 | 229 | |
| Labour | Anne Chatt | 3.1 | 97 | |
| SNP hold | ||||
| Valid: 3,157 Spoilt: 21 Quota: 1,579 Turnout: 3,178 | ||||
| Party | Candidate | FPv% | Count | |||||
|---|---|---|---|---|---|---|---|---|
| 1 | 2 | 3 | 4 | 5 | ||||
| SNP | Tom Gray | 30.3 | 1,555 | 1,569 | 1,769 | 2,299 | 3,302 | |
| Conservative | John Blackie | 33.4 | 1,713 | 1,724 | 1,785 | 2,208 | ||
| Liberal Democrats | Neil Gaunt | 20.3 | 1,042 | 1,057 | 1,321 | |||
| Labour | Alistair Munro | 14.7 | 754 | 762 | ||||
| Independent | Chris Rennie | 1.2 | 61 | |||||
| SNP hold | ||||||||
| Valid: 5,125 Spoilt: 54 Quota: 2,563.5 Turnout: 5,179 | ||||||||
| Party | Candidate | FPv% | Count | |
|---|---|---|---|---|
| 1 | ||||
| SNP | Mike Williamson | 54.4 | 1,449 | |
| Conservative | Graham Rees | 22.4 | 596 | |
| Liberal Democrats | Victor Clements | 12.1 | 321 | |
| Independent | William Leske | 10.1 | 269 | |
| Independent | Chris Rennie | 1.0 | 27 | |
| SNP hold | ||||
| Valid: 2,662 Spoilt: 23 Quota: 1,332 Turnout: 2,685 | ||||
2012-2017
| Party | Candidate | FPv% | Count | |
|---|---|---|---|---|
| 1 | ||||
| SNP | Andrew Parrott | 51.1 | 3,589 | |
| Conservative | Chris Ahern | 23.9 | 1,679 | |
| Labour | Lorna Redford | 13.4 | 939 | |
| Liberal Democrats | Philip Brown | 10.0 | 701 | |
| Independent | Ian Thomson | 1.7 | 119 | |
| SNP hold | ||||
| Valid: 7,027 Spoilt: 104 Quota: 3,515 Turnout: 7,131 | ||||
| Party | Candidate | FPv% | Count | |||
|---|---|---|---|---|---|---|
| 1 | 2 | 3 | ||||
| Conservative | Kathleen Baird | 48.5 | 1,651 | 1,681 | 1,720 | |
| SNP | Wilma Lumsden | 38.4 | 1,327 | 1,334 | 1,370 | |
| Labour | Dave MacKenzie | 6.3 | 219 | 228 | 280 | |
| Liberal Democrats | George Hayton | 4.5 | 157 | 163 | ||
| UKIP | Denise Baykal | 2.2 | 77 | |||
| Conservative gain from Independent | ||||||
| Valid: 3,431 Spoilt: 19 Quota: 1,716 Turnout: 3,450 | ||||||
2017-2022
| Party | Candidate | FPv% | Count | ||||||
|---|---|---|---|---|---|---|---|---|---|
| 1 | 2 | 3 | 4 | 5 | 6 | ||||
| Conservative | Audrey Coates | 31.2 | 1,734 | 1,738 | 1,744 | 1,762 | 2,381 | 2,863 | |
| SNP | Pauline Leitch | 32.1 | 1,780 | 1,781 | 1,813 | 1,883 | 2,227 | ||
| Liberal Democrats | Liz Barrett | 28.8 | 1,597 | 1,601 | 1,627 | 1,733 | |||
| Labour | Tricia Duncan | 5.7 | 314 | 319 | 332 | ||||
| Scottish Green | Elspeth MacLachlan | 1.8 | 102 | 105 | 332 | ||||
| Independent | Denise Baykal | 0.5 | 25 | ||||||
| Conservative hold | |||||||||
| Valid: 5,552 Spoilt: 55 Quota: 2,777 Turnout: 5,607 | |||||||||
| Party | Candidate | FPv% | Count | ||||||
|---|---|---|---|---|---|---|---|---|---|
| 1 | 2 | 3 | 4 | 5 | 6 | ||||
| Conservative | John Duff | 46.7 | 1,907 | 1,908 | 1,923 | 1,930 | 1,977 | 2,084 | |
| SNP | John Kellas | 35.9 | 1,466 | 1,467 | 1,472 | 1,509 | 1,594 | 1,712 | |
| Independent | Avril Taylor | 6.9 | 280 | 286 | 299 | 325 | 391 | ||
| Labour | Jayne Ramage | 5.8 | 239 | 240 | 256 | 280 | |||
| Scottish Green | Mary McDougall | 2.5 | 104 | 106 | 118 | ||||
| Liberal Democrats | Chris Rennie | 1.9 | 78 | 78 | |||||
| Independent | Denise Baykal | 0.3 | 12 | ||||||
| Conservative hold | |||||||||
| Valid: 4,086 Spoilt: 31 Quota: 2,044 Turnout: 4,117 | |||||||||
| Party | Candidate | FPv% | Count | |
|---|---|---|---|---|
| 1 | ||||
| SNP | Ian Massie | 61.0 | 1,406 | |
| Conservative | Aziz Rehman | 22.9 | 528 | |
| Labour | Nicola Ferry | 9.5 | 220 | |
| Liberal Democrats | James Graham | 3.9 | 91 | |
| Scottish Green | Paul Vallot | 2.6 | 60 | |
| SNP hold | ||||
| Valid: 2,305 Spoilt: 28 Quota: 1,153 Turnout: 2,333 | ||||
| Party | Candidate | FPv% | Count | ||||||
|---|---|---|---|---|---|---|---|---|---|
| 1 | 2 | 3 | 4 | 5 | 6 | ||||
| Liberal Democrats | Liz Barrett | 31.6 | 1,823 | 1,824 | 1,851 | 1,925 | 2,749 | 3,571 | |
| SNP | Iain MacPherson | 32.9 | 1,898 | 1,900 | 1,960 | 2,017 | 2,110 | ||
| Conservative | Andy Chan | 29.4 | 1,698 | 1,705 | 1,713 | 1,729 | |||
| Labour | Tricia Duncan | 3.5 | 204 | 205 | 224 | ||||
| Scottish Green | Elspeth MacLachlan | 2.3 | 135 | 136 | |||||
| UKIP | Lynda Davis | 0.3 | 18 | ||||||
| Liberal Democrats gain from SNP | |||||||||
| Valid: 5,776 Spoilt: 51 Quota: 2,889 Turnout: 5,827 | |||||||||
| Party | Candidate | FPv% | Count | |
|---|---|---|---|---|
| 1 | ||||
| Conservative | Frank Smith | 51.2 | 1,819 | |
| SNP | Michelle Frampton | 37.3 | 1,327 | |
| Labour | Craig Masson | 7.5 | 267 | |
| Liberal Democrats | Claire McLaren | 4.0 | 143 | |
| Conservative gain from SNP | ||||
| Valid: 3,556 Spoilt: 17 Quota: 1,779 Turnout: 3,573 | ||||
2022-2027
| Party | Candidate | FPv% | Count | |||||
|---|---|---|---|---|---|---|---|---|
| 1 | 2 | 3 | 4 | 5 | ||||
| SNP | Carol Mair | 44.7 | 917 | 946 | 961 | 1,015 | 1,058 | |
| Labour | Kirsten Nkwocha-Dyer | 15.3 | 313 | 331 | 358 | 374 | 409 | |
| Conservative | Aziz Rehman | 14.4 | 296 | 297 | 316 | 323 | 365 | |
| Reform UK | Sonia Davidson | 10.2 | 209 | 213 | 220 | 234 | ||
| Alba | Robert Reid | 6.5 | 133 | 139 | 145 | |||
| Liberal Democrats | Tina Ng-a-Mann | 4.6 | 95 | 111 | ||||
| Scottish Green | Caitlin Ripley | 4.2 | 87 | |||||
| SNP gain from Labour | ||||||||
| Valid: 2,050 Spoilt: 21 Quota: 1,026 Turnout: 2,071 | ||||||||
| Party | Candidate | FPv% | Count | ||||||
|---|---|---|---|---|---|---|---|---|---|
| 1 | 2 | 3 | 4 | 5 | 6 | ||||
| Liberal Democrats | Alan Watt | 30.0 | 978 | 1,006 | 1,035 | 1,213 | 1,509 | 2,110 | |
| Conservative | Amanda Runciman | 32.1 | 1,045 | 1,049 | 1,123 | 1,169 | 1,206 | ||
| SNP | Catherine Scott | 17.4 | 568 | 613 | 626 | 696 | |||
| Labour | Ken McCracken | 11.2 | 366 | 382 | 388 | ||||
| Reform UK | Ian Thomas | 6.0 | 194 | 198 | |||||
| Scottish Green | Nettie Sutherland | 3.3 | 107 | ||||||
| Liberal Democrats gain from Conservative | |||||||||
| Valid: 3,258 Spoilt: 22 Quota: 1,630 Turnout: 3,280 | |||||||||
References
- ↑ "Initial Statutory Reviews of Electoral Arrangements". National Records of Scotland. Retrieved 21 July 2025.
- ↑ "Third Statutory Review of Electoral Arrangements - Perth and Kinross Council Area" (PDF). Local Government Boundary Commission for Scotland. Retrieved 26 July 2025.
- ↑ "Fifth Statutory Review of Electoral Arrangements Final Recommendations - Perth and Kinross Council Area" (PDF). Local Government Boundary Commission for Scotland. Retrieved 24 February 2025.
- ↑ "Breakdown of results Ward 4 – Highland by-election" (PDF). Perth & Kinross Council. Archived from the original (PDF) on 6 September 2012. Retrieved 27 July 2025.
- ↑ "Breakdown of results Ward 7 – Strathallan by-election" (PDF). Perth & Kinross Council. Archived from the original (PDF) on 6 September 2012. Retrieved 27 July 2025.
- ↑ "Highland, 2011". Scottish Elections. Archived from the original on 5 August 2014. Retrieved 27 July 2025.
- ↑ "Perth & Kinross Council By Election 2015 Election Results Ward 12 - Perth City Centre" (PDF). Perth & Kinross Council. Retrieved 27 July 2025.
- ↑ "BY ELECTION 07-04-2016 Transfers Report Ward 9 - Almond and Earn" (PDF). Perth & Kinross Council. Retrieved 27 July 2025.
- ↑ "Preference Summary Report". pkc.gov.uk. Retrieved 24 August 2021.
- ↑ "Ward 4 - Highland Transfers Report" (PDF). Perth & Kinross Council. Retrieved 27 July 2025.
- ↑ "Ward 11 - Perth City North Transfers Report" (PDF). Perth & Kinross Council. Retrieved 27 July 2025.
- ↑ "Ward 10 - Perth City South Transfers Report" (PDF). Perth & Kinross Council. Retrieved 27 July 2025.
- ↑ "Ward 9 - Almond and Earn Transfers Report" (PDF). Perth & Kinross Council. Retrieved 27 July 2025.
- ↑ "Ward 11 - Perth City North Transfers Report" (PDF). Perth & Kinross Council. Retrieved 27 July 2025.
- ↑ "Ward 7 - Strathallan Transfers Report" (PDF). Perth & Kinross Council. Retrieved 27 July 2025.