Rheobase
From Wikipedia, the free encyclopedia

Rheobase is a measure of membrane potential excitability. In neuroscience, rheobase is the minimal current amplitude of infinite duration that results in the depolarization threshold of the cell membranes being reached, such as an action potential or the contraction of a muscle.[1] In Greek, the root rhe translates to "current or flow", and basi means "bottom or foundation": thus the rheobase is the minimum current that will produce an action potential or muscle contraction.
Rheobase can be best understood in the context of the strength-duration relationship (Fig. 1).[2] The ease with which a membrane can be stimulated depends on two variables: the strength of the stimulus, and the duration for which the stimulus is applied.[3] These variables are inversely related: as the strength of the applied current increases, the time required to stimulate the membrane decreases (and vice versa) to maintain a constant effect.[3] Mathematically, rheobase is equivalent to half the current that needs to be applied for the duration of chronaxie, which is a strength-duration time constant that corresponds to the duration of time that elicits a response when the nerve is stimulated at twice rheobasic strength.[3]
The strength-duration curve was first discovered by G. Weiss in 1901, but it was not until 1909 that Louis Lapicque coined the term rheobase.[4] Many studies are being conducted in relation to rheobase values and the dynamic changes throughout maturation and between different nerve fibers.[5] In the past strength-duration curves and rheobase determinations were used to assess nerve injury; today, they play a role in clinical identification of many neurological pathologies, including diabetic neuropathy, CIDP, Machado–Joseph disease,[6] and ALS.[7]
Lapicque's Equation
The strength-duration time constant (chronaxie) and rheobase are parameters that describe the strength-duration curve—the curve that relates the intensity of a threshold stimulus to its duration. As the duration of a test stimulus increases, the strength of the current required to activate a single fiber action potential decreases.
The strength-duration curve is a plot of the threshold current (I) versus pulse duration (d) required to stimulate excitable tissue.[4] As mentioned, the two important points on the curve are rheobase (b) and chronaxie (c), which correlates to twice the rheobase (2b). Strength-duration curves are useful in studies where the current required is changed when the pulse duration is changed.[8]
In 1907, Louis Lapicque, a French neuroscientist, proposed his exponential equation for the strength-duration curve. His equation for determining current I:
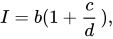
where b relates to the rheobase value and c relates to the chronaxie value over duration d.
Lapicque's hyperbolic formula combines the threshold amplitude of a stimulus with its duration. This represents the first manageable with physiologically defined parameters that could compare excitability of different tissues, reflecting an urgent need at the turn of the 20th century.[4] Lapicque used constant-current, capacitor-discharge pulses to obtain chronaxie for a wide variety of excitable tissues.[4] Rheobase in the Lapicque equation is the asymptote of the hyperbolic curve at very long durations.
Weiss's Equation
In 1901, G. Weiss proposed another linear equation using a charge Q duration curve. The electrical charge Q can be calculated with the following equation:
- or
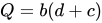

again, where I is the current is measured in amperes multiplied by duration d. b relates to the rheobase value and c relates to the chronaxie value.
Rheobase in the Weiss formula is the slope of the graph. The x-intercept of the Weiss equation is equal to b x c, or rheobase times chronaxie.
This equation suggests that a graph of threshold stimulus strength versus stimulus duration should show a decay toward zero as stimulus duration is increased, so the stimulus strength required to reach threshold is predicted to increase during more protracted stimulation.[4] The strength-duration curve for a typical nerve membrane is slightly skewed from the predicted graph, in that the curve flattens out in response to repetitive stimulation reaching an asymptote representing rheobase.[4] When the duration of a stimulus is prolonged, charge transfer and membrane potential rise exponentially to a plateau (instead of increasing linearly with time).[4][6] When rheobase exceeds the strength of the stimulus, stimulation fails to generate action potentials (even with large values of t); thus if the stimulus is too small, the membrane potential never reaches threshold. The disparity between the shape of the strength-duration curve predicted by Weiss's equation and the one actually observed in neural membranes can be attributed to leakage of charge that occurs under physiological conditions, a feature of the electrical resistance of the membrane.[4][6] Weiss' equation predicts the relationship between stimulus strength and duration for an ideal capacitor with no leakage resistance.
Despite this limitation, Weiss’s equation provides the best fit for strength-duration data and indicates that rheobase and time constant (chronaxie) can be measured from the charge duration curve with a very small margin of error.[9] Weiss used rectangular, constant-current pulses and found that threshold charge required for stimulation increased linearly with pulse duration.[4] He also found that stimulus charge, the product of stimulus current and stimulus duration is proportional to rheobase, so that only two stimulus durations are necessary to calculate rheobase.[6]
Measurement
The use of strength-duration curves was developed in the 1930s, followed by the use of threshold current measurements for the study of human axonal excitability in the 1970s.[6] Use of these methods in toxic neuropathies has enabled researchers to designate protective factors for many peripheral nerve disorders, and several diseases of the central nervous system (see Clinical Significance).
Nerve excitability examination complements conventional nerve conduction studies by allowing insight into biophysical characteristics of axons, as well as their ion-channel functioning.[10] The protocol is aimed at providing information about nodal as well as internodal ion channels, and the indices are extremely sensitive to axon membrane potential.[10] These studies have provided insight into conditions characterized by changes in resting potential, such as electrolyte concentration and pH, as well as specific ion-channel and pump function in normal and diseased nerves.[11] Furthermore, software programs enabling the calculation of rheobasic and time constant values from both normal and diseased nerves have recently enabled researchers to pinpoint some important factors for a number of pervasive nerve disorders, many of which involve substantial demyelination (see Clinical Significance).[10][11] Supraximal electrical stimulation and measurement of conduction velocity and amplitudes of compound motor (CMAP) and sensory (SNAP) responses provide measures of the number and conduction velocities of large myelinated fibers.[10][11] Additionally, multiple measures of excitability in the TROND protocol permit assessment of ion channels (transient and persistent Na+ channels, slow K+ channels) at nodes of Ranvier by computing stimulus response curves, strength duration time constant (chronaxie), rheobase, and the recovery cycle after passage of an action potential.[10] This is accomplished by applying long polarizing currents to the nerve and measuring the influence of voltage on voltage gated-ion channels beneath myelin.[10]
In Neurons
In neurons, the rheobase is defined as the smallest injected step current, of infinite duration, that results in one action potential. In practice, there are several challenges of measuring the rheobase. The general protocol is to inject currents of various amplitudes, observe if any action potentials were produced, and then further refine the injected current magnitude until the boundary between spiking and non-spiking behavior is identified.
Duration
Because it is not possible to wait an infinite amount of time, trial currents are injected for finite durations. The current duration varies among publications, but is on the order of 0.1-5 seconds. However, this also implies that an injected current that did not result in spikes could have resulted in spikes if the duration was longer. For this reason, the current duration should be specified when reporting a cell's rheobase.
Precision
In addition to current duration, it is not possible to find the exact rheobase value in a real cell. In publications, a common method is to try various currents at some increments (e.g. 10 pA), and find the two consecutive current amplitudes that do and do not result in action potentials. The smallest difference between the lower and upper currents used is the rheobase search precision: the "true" rheobase is somewhere between the two tested current values.
Precision is also affected by thermal noise and stochastic nature of ion channels. If a cell does not reliably spike at a certain current amplitude, the search method could be modified to include multiple repeated current injections to find such current that reliably results in spikes.
Maximum Current Amplitude Range
When searching for the rheobase, a proper current amplitude range must be chosen. If the maximum current used is too small, no spikes will be produced. If too large, cell health might be compromised. Before starting the search, the cell's membrane input resistance (from negative current injections) can be measured and used to estimate the current necessary to activate the cell (e.g. if -10pA reduces the potential by 20mV, then a cell that rests at -60mV will likely spike at least once in response to +30pA injections).
Negative Rheobase
The standard rheobase definition assumes that a given cell does not spike when a current is not injected. However, some cells are spontaneously spiking (e.g. Cardiac pacemaker cells). For such cells, a negative (inhibitory) current will quiet them, while a slightly less negative current will result in action potentials. In such cases, stimulation protocols that utilize the rheobase and assume that spiking rates are proportional to the rheobase will produce nonsense results (e.g. spike rate in response to 2X rheobase will not be greater than at 1.5X rheobase).
Bursting cells
Bursting cells will produce multiple spikes once activated. For such cells, it can be very difficult to find the current that produces only a single spike within a given time frame. For such cells, finding the boundary between currents that result in bursts and no bursts could be used.
Cells with Sub-threshold Oscillations
Cells that exhibit sub-threshold oscillations will exhibit phase-dependent rheobase. If the current step onset co-insides with the peak of a sub-threshold oscillation (cell is closer to the firing threshold), a smaller current will be needed to elicit a spike. Conversely, if the step onset co-insides with the trough of the oscillation (further away from the threshold), a larger current will be necessary to produce a spike. Using different delays before onset and repeating the current injections can be used to find the current that will guarantee that a spike will be produced regardless of sub-threshold oscillation phase.
Temperature
Slice temperature can affect ion channel kinetics and alter the rheobase. This means that a current that produces one spike under one temperature, might not produce any spikes under a different temperature. For this reason, the slice temperature should be specified when reporting a cell's rheobase.
Neurobiological significance
The properties of the nodal membrane largely determine the axon's strength-duration properties, and these will change with changes in membrane potential, with temperature, and with demyelination as the exposed membrane is effectively enlarged by the inclusion of paranodal and intermodal membrane.[9] Thus, the strength-duration time constant is a reflection of persistent Na+ channel function, and is furthermore influenced by membrane potential and passive membrane properties.[10] As such, many aspects of nerve excitability testing depend on sodium channel functions: namely, the strength-duration time constant, the recovery cycle, the stimulus-response curve, and the current-threshold relationship. Measuring responses in nerve that are related to nodal function (including strength-duration time constant and rheobase) and internodal function has allowed insight into normal axon physiology as well as normal fluctuations of electrolyte concentrations.[7]
Rheobase is influenced by excitability of the nodal membrane, which increases with hyperpolarization and decreases with depolarization. Its voltage-dependence follows the behavior of persistent sodium channels that are active near threshold and have rapidly activating, slowly inactivating channel properties.[6] Depolarization increases the Na+ current through the persistent channels, resulting in a lower rheobase; hyperpolarization has the opposite effect. The strength-duration time constant increases with demyelination, as the exposed membrane is enlarged by inclusion of paranodal and internodal membrane. The function of the latter of these is to maintain resting membrane potential, so internodal dysfunction significantly affects excitability in a diseased nerve. Such implications are further discussed in Clinical Significance.
Sensory nerves vs. motor nerves
Nerve excitability studies have established a number of biophysical differences between human sensory and motor axons.[6] Even though the diameters and conduction velocities of the most excitable motor and sensory fibers are similar, sensory fibers have significantly longer strength-duration time constants.[11] As a result, sensory nerves have a longer strength-duration time constant and a lower rheobase than motor nerves.[7]
Many studies have suggested that differences in the expression of threshold channels could account for the sensory-motor differences in strength-duration time constant.[11] The differences in strength-duration time constant and rheobase of normal sensory and motor axons are thought to reflect differences in expression of a persistent Na+ conductance.[12] Additionally, sensory axons accommodate more to long-lasting hyperpolarizing currents than do motor axons, suggesting a greater expression of the hyperpolarization-activated inward rectifier channels.[12] Finally, the electrogenic Na+/K+-ATPase is more active in sensory nerves, which have a greater dependence on this pump to maintain resting membrane potential than do motor nerves.[6]
Increases in the strength-duration time constant are observed when this conductance is activated by depolarization, or by hyperventilation.[7] However, demyelination, which exposes internodal membrane with a higher membrane time constant than that of the original node, can also increase strength-duration time constant.[13]
The strength-duration time constant of both cutaneous and motor afferents decreases with age, and this corresponds to an increase in rheobase.[7] Two possible reasons for this age-related decrease in the strength-duration time constant have been proposed. First, nerve geometry might change with age because of axonal loss and neural fibrosis. Secondly, the persistent Na+ conductance might decrease maturation. Significant decreases in threshold for sensory and motor fibers have been observed during ischemia.[7] These decreases in threshold were furthermore associated with significant increases in the strength-duration time constant, appreciably indicating a significant decrease in rheobase current. These changes are thought to be the result of non-inactivating, voltage-dependent Na+ channels, which are active at resting potential.