Scott Lake (Washington)
Lake in Thurston County, Washington state
From Wikipedia, the free encyclopedia
Scott Lake is a lake in Thurston County, Washington, United States.
,_2021-09-01,_02.jpg)
| Scott Lake | |
|---|---|
Scott Lake, 2021 | |
    | |
| Location | Thurston County, Washington |
| Coordinates | 46°55′11″N 122°55′53″W |
| Type | Lake |
| Spruce Creek (5.08 cu ft/s) | |
| Allen Creek (6.77 cu ft/s)[1] | |
| 2.52 sq mi (6.5 km2) | |
| Basin countries | United States |
| Max. length | 0.44 mi (0.71 km) |
| Max. width | 0.40 mi (0.64 km) |
Surface area | 69 acres (28 ha) |
Average depth | 11 ft (3.4 m) |
| Max. depth | 18 ft (5.5 m) |
Water volume | 760 acre⋅ft (940,000 m3) |
Shore length1 | 6,700 ft (2,000 m) |
Surface elevation | 189 ft (58 m) |
| Frozen | Lake freezes only during unusual cold snaps. |
| References | [2][3][4][5] |
| 1 Shore length is not a well-defined measure. | |
Geography
Hydrology
The lake receives its water from a creek that comes out of Deep Lake. The creek is officially unnamed,[1] but is referred to as Spruce Creek by Millersylvania State Park.
The creek that flows out of Scott Lake is officially named Allen Creek.[1] Allen Creek flows into Beaver Creek.[1] a tributary of the Black River. Thus it is part of the Chehalis River watershed.
 Spruce Creek, 2009
 Allen Creek, 2009
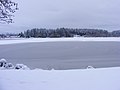 Scott Lake, frozen over, 2008


,_2008-12-21.jpg)
Environment and ecology
Eurasian water-milfoil (myriophyllum spicatum), an invasive species, was found in the lake in the spring of 1996.[8] The area is subject to occasional flooding in winter. Its causes are being studied.[9]
Recreation
A public nine-hole golf course[10] and a private park, opened only to residents of the Scott Lake Community, are located next to the lake.
Climate of Scott Lake
The climate of Scott Lake is cloudy and rainy during the fall, winter, and spring. Summers are generally warmer and sunnier. There is an average of 161.6 days of precipitation per year,[11] and an average of 228.5 days of complete cloud cover per year.[11] On December 21, there is 15 hours and 30 minutes of darkness.[12] On June 21, there is 15 hours and 53 minutes of daylight.[12] Until the 2021 North American heat wave, the highest temperature ever recorded was 104 °F on August 9, 1981[13] and July 29, 2009.[14] The lowest temperature ever recorded was −8 °F on January 1, 1979.[13] The most rain ever recorded in one day was 4.82 inches[15] on January 7, 2009.
The closest weather station to Scott Lake is located at Webster Nursery near Tumwater. The closest weather station to Scott Lake that has a long history of weather records is located at the Olympia Regional Airport in Tumwater.
| Climate data for Olympia Regional Airport, Washington (1991−2020 normals, extremes 1948−present) | |||||||||||||
|---|---|---|---|---|---|---|---|---|---|---|---|---|---|
| Month | Jan | Feb | Mar | Apr | May | Jun | Jul | Aug | Sep | Oct | Nov | Dec | Year |
| Record high °F (°C) | 64 (18) |
73 (23) |
79 (26) |
88 (31) |
96 (36) |
110 (43) |
104 (40) |
104 (40) |
98 (37) |
90 (32) |
74 (23) |
64 (18) |
110 (43) |
| Mean maximum °F (°C) | 56.3 (13.5) |
59.4 (15.2) |
67.9 (19.9) |
76.2 (24.6) |
83.9 (28.8) |
87.9 (31.1) |
93.6 (34.2) |
92.2 (33.4) |
86.3 (30.2) |
73.7 (23.2) |
61.5 (16.4) |
55.5 (13.1) |
96.0 (35.6) |
| Mean daily maximum °F (°C) | 46.0 (7.8) |
49.1 (9.5) |
53.7 (12.1) |
58.9 (14.9) |
66.1 (18.9) |
70.8 (21.6) |
77.6 (25.3) |
78.0 (25.6) |
72.1 (22.3) |
60.2 (15.7) |
50.6 (10.3) |
44.9 (7.2) |
60.7 (15.9) |
| Daily mean °F (°C) | 39.6 (4.2) |
40.7 (4.8) |
44.1 (6.7) |
48.2 (9.0) |
54.5 (12.5) |
59.1 (15.1) |
64.2 (17.9) |
64.2 (17.9) |
59.1 (15.1) |
50.3 (10.2) |
43.2 (6.2) |
38.9 (3.8) |
50.5 (10.3) |
| Mean daily minimum °F (°C) | 33.2 (0.7) |
32.3 (0.2) |
34.5 (1.4) |
37.5 (3.1) |
43.0 (6.1) |
47.4 (8.6) |
50.7 (10.4) |
50.5 (10.3) |
46.2 (7.9) |
40.5 (4.7) |
35.8 (2.1) |
32.8 (0.4) |
40.4 (4.7) |
| Mean minimum °F (°C) | 18.8 (−7.3) |
19.0 (−7.2) |
23.9 (−4.5) |
27.5 (−2.5) |
32.3 (0.2) |
38.4 (3.6) |
42.7 (5.9) |
41.9 (5.5) |
35.9 (2.2) |
27.9 (−2.3) |
21.6 (−5.8) |
18.4 (−7.6) |
12.6 (−10.8) |
| Record low °F (°C) | −8 (−22) |
−1 (−18) |
9 (−13) |
23 (−5) |
25 (−4) |
30 (−1) |
35 (2) |
33 (1) |
25 (−4) |
14 (−10) |
−1 (−18) |
−7 (−22) |
−8 (−22) |
| Average precipitation inches (mm) | 7.80 (198) |
5.09 (129) |
5.68 (144) |
3.67 (93) |
2.26 (57) |
1.46 (37) |
0.53 (13) |
0.96 (24) |
2.04 (52) |
5.07 (129) |
8.21 (209) |
7.85 (199) |
50.62 (1,286) |
| Average snowfall inches (cm) | 2.0 (5.1) |
0.6 (1.5) |
0.1 (0.25) |
0.0 (0.0) |
0.0 (0.0) |
0.0 (0.0) |
0.0 (0.0) |
0.0 (0.0) |
0.0 (0.0) |
0.0 (0.0) |
0.0 (0.0) |
1.2 (3.0) |
3.9 (9.9) |
| Average precipitation days (≥ 0.01 in) | 20.3 | 16.4 | 18.8 | 16.3 | 11.4 | 8.5 | 4.0 | 4.8 | 8.1 | 15.1 | 19.5 | 20.2 | 163.4 |
| Average snowy days (≥ 0.1 in) | 0.5 | 0.7 | 0.1 | 0.0 | 0.0 | 0.0 | 0.0 | 0.0 | 0.0 | 0.0 | 0.1 | 0.8 | 2.2 |
| Average relative humidity (%) | 87.5 | 84.5 | 80.0 | 75.6 | 72.9 | 72.4 | 70.8 | 72.1 | 77.6 | 85.1 | 88.4 | 89.1 | 79.7 |
| Average dew point °F (°C) | 34.5 (1.4) |
36.0 (2.2) |
36.9 (2.7) |
39.2 (4.0) |
43.9 (6.6) |
48.9 (9.4) |
52.0 (11.1) |
52.7 (11.5) |
49.6 (9.8) |
44.8 (7.1) |
39.6 (4.2) |
35.4 (1.9) |
42.8 (6.0) |
| Source 1: NOAA (dew points and relative humidity 1961–1990)[16][17] | |||||||||||||
| Source 2: National Weather Service[18] | |||||||||||||