St Albans City and District Council elections
Local government elections in Hertfordshire, England
From Wikipedia, the free encyclopedia
St Albans City and District Council elections are held three years out of every four to elect members of St Albans City and District Council in Hertfordshire, England. Since the last boundary changes in 2022 the council has comprised 56 councillors, with the district being divided into 20 wards. Elections to Hertfordshire County Council are held in the fourth year of the cycle when there are no district council elections.[1]
Council elections
Summary of the council composition after each council elections, click on the year for full details of each election.[2] Boundary changes took place for the 1999 election increasing the number of seats by 1.[3]
| Year | Conservative | Liberal Democrats[a] | Labour | Green | Independents & Others |
Council control after election | ||
|---|---|---|---|---|---|---|---|---|
| Local government reorganisation; council established (54 seats) | ||||||||
| 1973 | 32 | 7 | 14 | – | 1 | Conservative | ||
| 1976 | 45 | 1 | 6 | 0 | 2 | Conservative | ||
| New ward boundaries (57 seats)[4] | ||||||||
| 1979 | 43 | 2 | 8 | 0 | 4 | Conservative | ||
| 1980 | 37 | 5 | 11 | 0 | 4 | Conservative | ||
| 1982 | 29 | 15 | 10 | 0 | 3 | Conservative | ||
| 1983 | 30 | 17 | 9 | 0 | 1 | Conservative | ||
| 1984 | 25 | 23 | 7 | 0 | 2 | No overall control | ||
| 1986 | 23 | 25 | 8 | 0 | 1 | No overall control | ||
| 1987 | 24 | 25 | 7 | 0 | 1 | No overall control | ||
| 1988 | 32 | 17 | 8 | 0 | 0 | Conservative | ||
| 1990 | 31 | 17 | 8 | 0 | 1 | Conservative | ||
| 1991 | 27 | 20 | 9 | 0 | 0 | No overall control | ||
| 1992 | 23 | 23 | 10 | 0 | 1 | No overall control | ||
| 1994 | 19 | 29 | 9 | 0 | 0 | Liberal Democrats | ||
| 1995 | 13 | 34 | 10 | 0 | 0 | Liberal Democrats | ||
| 1996 | 5 | 39 | 11 | 0 | 1 | Liberal Democrats | ||
| 1998 | 11 | 30 | 16 | 0 | 0 | Liberal Democrats | ||
| New ward boundaries (58 seats)[5] | ||||||||
| 1999 | 21 | 21 | 16 | 0 | 0 | No overall control | ||
| 2000 | 19 | 23 | 15 | 0 | 1 | No overall control | ||
| 2002 | 20 | 21 | 15 | 0 | 2[b] | No overall control | ||
| 2003 | 21 | 23 | 13 | 0 | 1 | No overall control | ||
| 2004 | 17 | 29 | 11 | 0 | 1 | Liberal Democrats | ||
| 2006 | 17 | 31 | 8 | 0 | 2 | Liberal Democrats | ||
| New ward boundaries (58 seats)[6] | ||||||||
| 2007 | 19 | 29 | 8 | 0 | 2 | Liberal Democrats | ||
| 2008 | 22 | 30 | 5 | 0 | 1 | Liberal Democrats | ||
| 2010 | 24 | 30 | 3 | 0 | 1 | Liberal Democrats | ||
| 2011 | 29 | 24 | 3 | 1 | 1 | Conservative | ||
| 2012 | 29 | 19 | 8 | 1 | 1 | Conservative | ||
| 2014 | 29 | 17 | 10 | 1 | 1 | Conservative | ||
| 2015 | 32 | 16 | 8 | 1 | 1 | Conservative | ||
| 2016 | 31 | 17 | 7 | 1 | 2 | Conservative | ||
| 2018 | 30 | 18 | 7 | 1 | 2 | Conservative | ||
| 2019 | 23 | 25 | 6 | 1 | 3 | No overall control | ||
| 2021 | 23 | 30 | 2 | 1 | 2 | Liberal Democrats | ||
| New ward boundaries (56 seats)[1] | ||||||||
| 2022 | 4 | 50 | 0 | 1 | 1 | Liberal Democrats | ||
| 2023 | 4 | 48 | 0 | 2 | 2[c] | Liberal Democrats | ||
| 2024 | 3 | 45 | 2 | 3 | 2[d] | Liberal Democrats | ||
| 2026 | ||||||||
- Notes:
District result maps
 1999 results map
 2000 results map
 2002 results map
 2003 results map
 2004 results map
 2006 results map
 2007 results map
 2008 results map
 2010 results map
 2011 results map
 2012 results map
 2014 results map
 2015 results map
 2016 results map
 2018 results map
 2019 results map
 2021 results map
 2022 results map
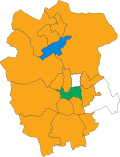 2023 results map
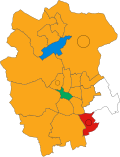 2024 results map


By-election results
By-elections occur when seats become vacant between council elections. Below is a summary of recent by-elections;[7] full by-election results can be found by clicking on the by-election name.