Thimphu District
District of Bhutan
From Wikipedia, the free encyclopedia

Thimphu Dzongkhag
ཐིམ་ཕུ་རྫོང་ཁག། Thimphu District | |
|---|---|
Thimphu District | |
 Location of Thimphu district within Bhutan | |
  Thimphu Dzongkhag Location within Bhutan | |
| Country | Bhutan |
| Headquarters | Thimphu |
| Area | |
• Total | 2,067 km2 (798 sq mi) |
| Population (2017) | |
• Total | 138,736 |
| • Rank | 1st |
| • Density | 67.12/km2 (173.8/sq mi) |
| Time zone | UTC+6 (BTT) |
| HDI (2021) | 0.832[1] very high · 1st |
| Website | www |
Thimphu District (Dzongkha: ཐིམ་ཕུ་རྫོང་ཁག།; Wylie: Thim-phu rdzong-khag) is a dzongkhag (district) of Bhutan. Thimphu is also the capital of Bhutan and the largest city in the whole kingdom.
Languages
Cultural sites
Important cultural sites of Thimphu include:
- Druk Wangditse Lhakhang
- Dechen Phodrang Central Monastic School
- Tshelung Ney is the second Draphu Maratika where Guru Rinpoche received life empowerment (Tse Ngedrup) from Tsepakme.[3]
- Chari Meditation Centre
- Druk Wangyel Complex, Dochula
- National Memorial Chorten
- Tango Choeying Dzong is the most important site of Phajo Drugom Zhigpo where Yidam Tandin appeared before him in person and delivered precepts to him.[4]
- Dodeydra Buddhist Institute
- Changangkha Lhakhang
- Thuji Dra is one of the four cliffs of Guru Rinpoche prophesied to Phajo Drugom Zhigpo by Guru Rinpoche.[5]
- Buddha Dordenma Statue at Buddha Point is one of the world’s largest and tallest Sitting Buddha statues. It is 169 feet (52 m) and sits upon a large meditation hall.[6]
- Domtsang Ney is a meditative cave of Guru Rinpoche.[7]
- Domendrel Tsho is a sacred lake near a place where Gyalse Tenzin Rabgye offered a Mandala to consecrate the Palace of Chador Namgyal, the King of Sikkim.[8]
- Jagar Damkelsa Ney, the sacred cliff where Drubthob Nagi Rinchen meditated to rescue his mother who was born in a hell.[9]
Administrative divisions

Thimphu District is divided into eight village groups (or gewogs) and one town (Thimphu):[10]
Lingzhi, Soe and Naro Gewogs belong to the Lingzhi Dungkhag subdistrict, the only subdistrict within Thimphu District. The remaining gewogs do not belong to any subdistrict.[11]
Town of Thimphu
Thimphu is the capital of Bhutan and of Thimphu District.
Environment
The northern half of Thimphu District (the gewogs of Kawang, Lingzhi, Naro and Soe – corresponding roughly to Lingzhi Dungkhag) is subject to environmental protection, falling within Jigme Dorji National Park.[12]
- Thimphu District
 View of Thimphu
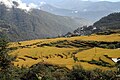 Rice terraces
 Traditional house
 108 Choerten on the Dochu La
 View from Dochu La


Climate
| Climate data for Thimphu-Simtokha, elevation 2,310 m (7,580 ft), (1996–2017 normals) | |||||||||||||
|---|---|---|---|---|---|---|---|---|---|---|---|---|---|
| Month | Jan | Feb | Mar | Apr | May | Jun | Jul | Aug | Sep | Oct | Nov | Dec | Year |
| Record high °C (°F) | 24.0 (75.2) |
25.0 (77.0) |
28.0 (82.4) |
30.0 (86.0) |
32.2 (90.0) |
32.0 (89.6) |
33.0 (91.4) |
32.5 (90.5) |
31.0 (87.8) |
31.0 (87.8) |
27.0 (80.6) |
24.0 (75.2) |
33.0 (91.4) |
| Mean daily maximum °C (°F) | 14.8 (58.6) |
16.6 (61.9) |
19.3 (66.7) |
22.4 (72.3) |
24.8 (76.6) |
26.7 (80.1) |
27.0 (80.6) |
27.3 (81.1) |
26.0 (78.8) |
23.7 (74.7) |
19.7 (67.5) |
16.6 (61.9) |
22.1 (71.7) |
| Daily mean °C (°F) | 6.3 (43.3) |
8.5 (47.3) |
11.6 (52.9) |
15.1 (59.2) |
18.2 (64.8) |
21.0 (69.8) |
21.8 (71.2) |
21.7 (71.1) |
20.3 (68.5) |
16.3 (61.3) |
11.5 (52.7) |
7.9 (46.2) |
15.0 (59.0) |
| Mean daily minimum °C (°F) | −2.2 (28.0) |
0.3 (32.5) |
3.8 (38.8) |
7.9 (46.2) |
11.6 (52.9) |
15.3 (59.5) |
16.5 (61.7) |
16.1 (61.0) |
14.6 (58.3) |
9.0 (48.2) |
3.2 (37.8) |
−0.8 (30.6) |
8.0 (46.4) |
| Record low °C (°F) | −8.5 (16.7) |
−7.0 (19.4) |
−7.0 (19.4) |
−2.0 (28.4) |
2.5 (36.5) |
8.0 (46.4) |
11.0 (51.8) |
9.0 (48.2) |
6.0 (42.8) |
−3.0 (26.6) |
−6.0 (21.2) |
−7.5 (18.5) |
−8.5 (16.7) |
| Average rainfall mm (inches) | 6.3 (0.25) |
9.2 (0.36) |
20.4 (0.80) |
29.9 (1.18) |
49.8 (1.96) |
97.7 (3.85) |
152.8 (6.02) |
120.8 (4.76) |
73.9 (2.91) |
43.1 (1.70) |
1.2 (0.05) |
3.7 (0.15) |
608.9 (23.97) |
| Average rainy days | 1.1 | 1.2 | 3.8 | 6.2 | 8.7 | 14.2 | 19.0 | 16.7 | 11.7 | 4.7 | 0.3 | 0.7 | 88.3 |
| Average relative humidity (%) | 68.6 | 62.6 | 62.8 | 60.2 | 63.2 | 67.0 | 72.7 | 72.2 | 71.2 | 66.6 | 62.1 | 64.0 | 66.1 |
| Source 1: National Center for Hydrology and Meteorology[13] | |||||||||||||
| Source 2: World Meteorological Organization (rainy days 1996–2018)[14] | |||||||||||||
