Val-Cenis
Commune in Auvergne-Rhône-Alpes, France
From Wikipedia, the free encyclopedia
Val-Cenis is a commune in the department of Savoie, southeastern France. The municipality was established on 1 January 2017 by merger of the former communes of Termignon (the seat), Bramans, Lanslebourg-Mont-Cenis, Lanslevillard and Sollières-Sardières.[3]

Val-Cenis | |
|---|---|
View of Val-Cenis | |
 Location of Val-Cenis | |
 Val-Cenis  Val-Cenis | |
| Coordinates: 45°16′41″N 6°49′05″E | |
| Country | France |
| Region | Auvergne-Rhône-Alpes |
| Department | Savoie |
| Arrondissement | Saint-Jean-de-Maurienne |
| Canton | Modane |
| Intercommunality | Haute Maurienne-Vanoise |
| Government | |
| • Mayor (2020–2026) | Jacques Arnoux[1] |
Area 1 | 408.05 km2 (157.55 sq mi) |
| Population (2023)[2] | 2,112 |
| • Density | 5.176/km2 (13.41/sq mi) |
| Time zone | UTC+01:00 (CET) |
| • Summer (DST) | UTC+02:00 (CEST) |
| INSEE/Postal code | 73290 /73500 |
| 1 French Land Register data, which excludes lakes, ponds, glaciers > 1 km2 (0.386 sq mi or 247 acres) and river estuaries. | |
Geography
Climate
Val-Cenis has a subarctic climate (Köppen climate classification Dfc). The average annual temperature in Val-Cenis is 3.0 °C (37.4 °F). The average annual rainfall is 890.2 mm (35.05 in) with May as the wettest month. The temperatures are highest on average in July, at around 11.8 °C (53.2 °F), and lowest in February, at around −4.4 °C (24.1 °F). The highest temperature ever recorded in Val-Cenis was 26.0 °C (78.8 °F) on 30 July 1983; the coldest temperature ever recorded was −25.0 °C (−13.0 °F) on 11 February 1986.
| Climate data for Val-Cenis (Lanslebourg-Mont-Cenis, altitude 2000m, 1981–2010 normals, extremes 1971–2014) | |||||||||||||
|---|---|---|---|---|---|---|---|---|---|---|---|---|---|
| Month | Jan | Feb | Mar | Apr | May | Jun | Jul | Aug | Sep | Oct | Nov | Dec | Year |
| Record high °C (°F) | 13.0 (55.4) |
14.5 (58.1) |
16.5 (61.7) |
18.0 (64.4) |
22.8 (73.0) |
24.0 (75.2) |
26.0 (78.8) |
25.0 (77.0) |
22.9 (73.2) |
19.7 (67.5) |
16.8 (62.2) |
14.0 (57.2) |
26.0 (78.8) |
| Mean daily maximum °C (°F) | −1.1 (30.0) |
−1.4 (29.5) |
0.8 (33.4) |
2.9 (37.2) |
8.1 (46.6) |
12.6 (54.7) |
15.4 (59.7) |
15.0 (59.0) |
11.0 (51.8) |
7.0 (44.6) |
1.9 (35.4) |
−0.5 (31.1) |
6.0 (42.8) |
| Daily mean °C (°F) | −4.0 (24.8) |
−4.4 (24.1) |
−2.2 (28.0) |
0.1 (32.2) |
5.0 (41.0) |
9.1 (48.4) |
11.8 (53.2) |
11.6 (52.9) |
7.9 (46.2) |
4.2 (39.6) |
−0.7 (30.7) |
−3.3 (26.1) |
3.0 (37.4) |
| Mean daily minimum °C (°F) | −6.9 (19.6) |
−7.3 (18.9) |
−5.3 (22.5) |
−2.7 (27.1) |
2.0 (35.6) |
5.6 (42.1) |
8.2 (46.8) |
8.2 (46.8) |
4.9 (40.8) |
1.5 (34.7) |
−3.2 (26.2) |
−6.1 (21.0) |
−0.1 (31.8) |
| Record low °C (°F) | −25.0 (−13.0) |
−25.0 (−13.0) |
−22.0 (−7.6) |
−14.0 (6.8) |
−9.2 (15.4) |
−4.6 (23.7) |
−1.5 (29.3) |
−3.0 (26.6) |
−6.5 (20.3) |
−9.9 (14.2) |
−18.0 (−0.4) |
−21.0 (−5.8) |
−25.0 (−13.0) |
| Average precipitation mm (inches) | 42.9 (1.69) |
33.9 (1.33) |
46.9 (1.85) |
62.4 (2.46) |
122.5 (4.82) |
97.7 (3.85) |
64.6 (2.54) |
83.3 (3.28) |
113.6 (4.47) |
106.8 (4.20) |
68.6 (2.70) |
47.0 (1.85) |
890.2 (35.05) |
| Average precipitation days (≥ 1.0 mm) | 6.9 | 6.0 | 7.3 | 9.4 | 11.8 | 9.8 | 7.9 | 8.5 | 8.5 | 9.1 | 8.2 | 7.1 | 100.5 |
| Source: Météo-France[4] | |||||||||||||
Population
Population data refer to the area corresponding with the commune as of January 2025.
| Year | Pop. | ±% p.a. |
|---|---|---|
| 1968 | 2,876 | — |
| 1975 | 1,539 | −8.55% |
| 1982 | 1,712 | +1.53% |
| 1990 | 1,908 | +1.36% |
| 1999 | 2,021 | +0.64% |
| 2007 | 2,052 | +0.19% |
| 2012 | 2,110 | +0.56% |
| 2017 | 2,088 | −0.21% |
| 2023 | 2,112 | +0.19% |
| Source: INSEE[5] | ||
Gallery
- Nature and landscapes
 The commune lies at the limit of the Vanoise National Park
 The Dent Parrachée
 Petit Mont Cenis Pass
 Permanent return of the wolf in the commune in 2003
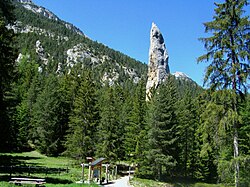 Monolithe of Sardières (93 m)
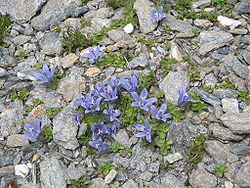 Mont Cenis campanula
 The lake and plateau of Mont Cenis
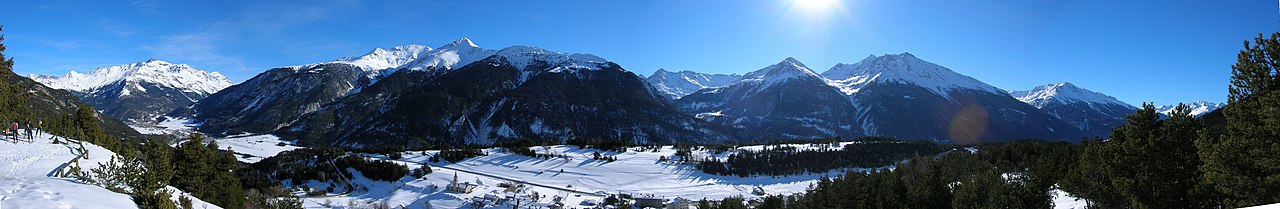 Panoramic view of the massifs of Mont Cenis and Ambin


.JPG)


