Waverley Borough Council elections
Local government elections in Surrey, England
From Wikipedia, the free encyclopedia
Waverley Borough Council is the local authority for the Borough of Waverley, Surrey. The council is elected every four years.
Council elections
| Year | Conservative | Liberal Democrats[a] | Labour | Green[b] | Farnham Residents | Independents & Others |
Council control after election | |
|---|---|---|---|---|---|---|---|---|
| Local government reorganisation; council established (61 seats) | ||||||||
| 1973 | 27 | 25 | 2 | – | – | 7 | No overall control | |
| 1976 | 42 | 6 | 3 | 0 | – | 10 | Conservative | |
| 1979 | 47 | 6 | 2 | 0 | – | 6 | Conservative | |
| New ward boundares (57 seats)[2] | ||||||||
| 1983 | 46 | 4 | 2 | 0 | – | 5 | Conservative | |
| 1987[3] | 42 | 13 | 0 | 0 | – | 2 | Conservative | |
| 1991 | 28 | 27 | 2 | 0 | – | 0 | No overall control | |
| 1995[4][5] | 17 | 37 | 2 | 0 | – | 1 | Liberal Democrats | |
| 1999 | 31 | 24 | 2 | 0 | – | 0 | Conservative | |
| New ward boundares (57 seats)[6][7][8] | ||||||||
| 2003 | 27 | 30 | 0 | 0 | – | 0 | Liberal Democrats | |
| 2007 | 51 | 3 | 0 | 0 | – | 3 | Conservative | |
| 2011 | 56 | 0 | 0 | 0 | – | 1 | Conservative | |
| 2015 | 53 | 0 | 0 | 0 | 3 | 1 | Conservative | |
| 2019 | 23 | 14 | 2 | 2 | 15 | 1 | No overall control | |
| New ward boundares (50 seats)[9] | ||||||||
| 2023 | 10 | 22 | 2 | 1 | 13 | 2 | No overall control | |
Results maps
 2003 results map
 2007 results map
 2011 results map
 2015 results map
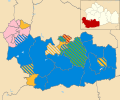 2019 results map
 2023 results map


By-election results
1995-1999
| Party | Candidate | Votes | % | ±% | |
|---|---|---|---|---|---|
| Conservative | 685 | 50.8 | |||
| Liberal Democrats | 550 | 40.8 | |||
| Labour | 113 | 8.4 | |||
| Majority | 135 | 10.0 | |||
| Turnout | 1,348 | ||||
| Conservative gain from Liberal Democrats | Swing | ||||
| Party | Candidate | Votes | % | ±% | |
|---|---|---|---|---|---|
| Conservative | 587 | 53.9 | +25.3 | ||
| Liberal Democrats | 460 | 42.2 | −29.2 | ||
| Labour | 42 | 3.9 | +3.9 | ||
| Majority | 127 | 11.7 | |||
| Turnout | 1,089 | 36.1 | |||
| Conservative gain from Liberal Democrats | Swing | ||||
1999-2003
| Party | Candidate | Votes | % | ±% | |
|---|---|---|---|---|---|
| Liberal Democrats | 670 | 57.9 | +12.0 | ||
| Conservative | 428 | 37.0 | −4.3 | ||
| Labour | 60 | 5.2 | −7.7 | ||
| Majority | 242 | 20.9 | |||
| Turnout | 1,158 | 28.6 | |||
| Liberal Democrats hold | Swing | ||||
| Party | Candidate | Votes | % | ±% | |
|---|---|---|---|---|---|
| Conservative | 1,660 | 50.0 | −12.4 | ||
| Liberal Democrats | 1,471 | 44.3 | +6.6 | ||
| Labour | 191 | 5.8 | +5.8 | ||
| Majority | 189 | 5.7 | |||
| Turnout | 3,322 | ||||
| Conservative hold | Swing | ||||
| Party | Candidate | Votes | % | ±% | |
|---|---|---|---|---|---|
| Liberal Democrats | 507 | 49.3 | +2.2 | ||
| Conservative | 478 | 46.5 | +26.4 | ||
| Labour | 43 | 4.2 | −5.0 | ||
| Majority | 29 | 2.8 | |||
| Turnout | 1,028 | 29.3 | |||
| Liberal Democrats hold | Swing | ||||
2003-2007
| Party | Candidate | Votes | % | ±% | |
|---|---|---|---|---|---|
| Conservative | Bob Frost | 693 | 47.0 | +14.8 | |
| Liberal Democrats | Joan Clark | 668 | 45.3 | −12.6 | |
| UKIP | Alastair Murdoch | 80 | 5.4 | −4.5 | |
| Labour | Andrew Jones | 34 | 2.3 | +2.3 | |
| Majority | 25 | 1.7 | |||
| Turnout | 1,475 | 46.0 | |||
| Conservative gain from Liberal Democrats | Swing | ||||
| Party | Candidate | Votes | % | ±% | |
|---|---|---|---|---|---|
| Liberal Democrats | Ken Reed | 936 | 48.1 | +0.7 | |
| Conservative | 855 | 43.9 | +1.8 | ||
| Labour | 156 | 8.0 | −2.5 | ||
| Majority | 81 | 4.2 | |||
| Turnout | 1,947 | 39.6 | |||
| Liberal Democrats gain from Conservative | Swing | ||||
| Party | Candidate | Votes | % | ±% | |
|---|---|---|---|---|---|
| Liberal Democrats | 1,421 | 50.6 | |||
| Conservative | 1,386 | 49.4 | |||
| Majority | 35 | 1.2 | |||
| Turnout | 2,807 | ||||
| Liberal Democrats hold | Swing | ||||
| Party | Candidate | Votes | % | ±% | |
|---|---|---|---|---|---|
| Conservative | Peter Martin | 833 | 58.9 | +7.0 | |
| Liberal Democrats | Simon Cordon | 555 | 39.2 | −8.9 | |
| Labour | 27 | 1.9 | +1.9 | ||
| Majority | 278 | 19.7 | |||
| Turnout | 1,415 | 44.2 | |||
| Conservative hold | Swing | ||||
| Party | Candidate | Votes | % | ±% | |
|---|---|---|---|---|---|
| Independent | Diane James | 372 | 38.4 | +38.4 | |
| Conservative | Richard Cleaves | 360 | 37.2 | −16.1 | |
| Liberal Democrats | Ruth Reed | 230 | 23.8 | −22.9 | |
| Labour | Richard Chaundy | 6 | 0.6 | +0.6 | |
| Majority | 12 | 1.2 | |||
| Turnout | 968 | 58.6 | |||
| Independent gain from Conservative | Swing | ||||
| Party | Candidate | Votes | % | ±% | |
|---|---|---|---|---|---|
| Conservative | 429 | 64.3 | −6.0 | ||
| Liberal Democrats | Richard Cole[11] | 238 | 35.7 | +13.5 | |
| Majority | 191 | 28.6 | |||
| Turnout | 667 | ||||
| Conservative hold | Swing | ||||
2011-2015
| Party | Candidate | Votes | % | ±% | |
|---|---|---|---|---|---|
| Conservative | Wyatt Ramsdale | 545 | 46.1 | −15.0 | |
| Independent | David Beaman | 294 | 24.9 | +24.9 | |
| UKIP | Richard Dancy | 252 | 21.3 | +21.3 | |
| Labour | Andrew Jones | 91 | 7.7 | −8.0 | |
| Majority | 251 | 21.2 | |||
| Turnout | 1,182 | ||||
| Conservative hold | Swing | ||||
2015-2019
| Party | Candidate | Votes | % | ±% | |
|---|---|---|---|---|---|
| Farnham Residents | Jerry Hyman | 386 | 40.6 | +6.0 | |
| Liberal Democrats | Stewart Edge | 292 | 30.7 | +6.3 | |
| Conservative | Nicholas Le Gal | 229 | 24.1 | −2.3 | |
| UKIP | George Hesse | 43 | 4.5 | N/A | |
| Majority | 94 | 9.9 | |||
| Turnout | 953 | 30.17 | |||
| Farnham Residents gain from Conservative | Swing | ||||
| Party | Candidate | Votes | % | ±% | |
|---|---|---|---|---|---|
| Farnham Residents | John Ward | 356 | 47.6 | +7.0 | |
| Conservative | Donal O'Neill | 233 | 31.1 | −14.0 | |
| Liberal Democrats | Sylvia Jacobs | 90 | 12.0 | N/A | |
| Independent | Andrew Jones | 43 | 3.4 | N/A | |
| UKIP | Jim Burroughs | 26 | 3.5 | N/A | |
| Majority | 123 | 16.5 | |||
| Turnout | 753 | 23.01 | |||
| Farnham Residents gain from Conservative | Swing | ||||
| Party | Candidate | Votes | % | ±% | |
|---|---|---|---|---|---|
| Conservative | Liz Townsend | 377 | 58.7 | +2.9 | |
| Liberal Democrats | Richard Cole | 187 | 29.1 | −1.0 | |
| UKIP | Rosaleen Egan | 78 | 12.1 | +12.1 | |
| Majority | 190 | 29.6 | |||
| Turnout | 642 | ||||
| Conservative hold | Swing | ||||
| Party | Candidate | Votes | % | ±% | |
|---|---|---|---|---|---|
| Liberal Democrats | Paul Follows | 266 | 37.8 | +37.8 | |
| Conservative | Stella Andersen-Payne | 246 | 35.0 | −6.5 | |
| Labour | Richard Ashworth | 151 | 21.5 | −4.6 | |
| Green | Susan Ryland | 40 | 5.7 | +5.7 | |
| Majority | 20 | 2.8 | |||
| Turnout | 703 | ||||
| Liberal Democrats gain from Conservative | Swing | ||||
| Party | Candidate | Votes | % | ±% | |
|---|---|---|---|---|---|
| Farnham Residents | David Beaman | 354 | 37.9 | +3.3 | |
| Liberal Democrats | Jo Aylwin | 338 | 36.1 | +11.7 | |
| Conservative | Rashida Nasir | 175 | 18.7 | −7.7 | |
| Labour | Rebecca Kaye | 42 | 4.5 | −10.0 | |
| Independent | Mark Westcott | 26 | 2.8 | +2.8 | |
| Majority | 16 | 1.7 | |||
| Turnout | 935 | ||||
| Farnham Residents hold | Swing | ||||
2019-2023
| Party | Candidate | Votes | % | ±% | |
|---|---|---|---|---|---|
| Independent | Maxine Gale | 452 | 50.6 | +50.6 | |
| Conservative | Carmel Oates | 328 | 36.7 | +17.3 | |
| Independent | Rosaleen Egan | 113 | 12.7 | +12.7 | |
| Majority | 124 | 13.9 | |||
| Turnout | 893 | ||||
| Independent hold | Swing | ||||
| Party | Candidate | Votes | % | ±% | |
|---|---|---|---|---|---|
| Liberal Democrats | Philip Townsend | 903 | 56.8 | +12.0 | |
| Conservative | Rosemary Burbridge | 686 | 43.2 | +4.2 | |
| Majority | 217 | 13.7 | |||
| Turnout | 1,589 | ||||
| Liberal Democrats hold | Swing | ||||
| Party | Candidate | Votes | % | ±% | |
|---|---|---|---|---|---|
| Independent | David Munro | 492 | 42.1 | +42.1 | |
| Green | Susan Ryland | 354 | 30.3 | −3.0 | |
| Conservative | Nabeel Nasir | 323 | 27.6 | −22.4 | |
| Majority | 138 | 11.8 | |||
| Turnout | 1,169 | ||||
| Independent gain from Conservative | Swing | ||||
| Party | Candidate | Votes | % | ±% | |
|---|---|---|---|---|---|
| Liberal Democrats | Julian Spence | 537 | 54.6 | +7.9 | |
| Conservative | Ged Hall | 446 | 45.4 | −1.1 | |
| Majority | 91 | 9.3 | |||
| Turnout | 983 | ||||
| Liberal Democrats gain from Conservative | Swing | ||||
| Party | Candidate | Votes | % | ±% | |
|---|---|---|---|---|---|
| Liberal Democrats | Dave Busby | 652 | 66.6 | +43.5 | |
| Conservative | Ian Mitchell | 297 | 30.3 | −11.2 | |
| Labour | Rebecca Aitken | 30 | 3.1 | −5.0 | |
| Majority | 355 | 36.3 | |||
| Turnout | 979 | ||||
| Liberal Democrats gain from Conservative | Swing | ||||
2023-2027
| Party | Candidate | Votes | % | ±% | |
|---|---|---|---|---|---|
| Farnham Residents | Alan Earwaker | 307 | 32.5 | −17.6 | |
| Liberal Democrats | Theresa Meredith-Hardy | 279 | 29.6 | New | |
| Labour | John Gaskell | 217 | 23.0 | −11.7 | |
| Conservative | Aly Fitch | 141 | 14.9 | −0.2 | |
| Majority | 28 | 2.9 | N/A | ||
| Turnout | 944 | 25.0 | −4.8 | ||
| Farnham Residents hold | Swing | N/A | |||
| Party | Candidate | Votes | % | ±% | |
|---|---|---|---|---|---|
| Liberal Democrats | Laura Cavaliere | 1,152 | 44.7 | ||
| Conservative | Gary Hudson | 902 | 35.0 | ||
| Independent | Tony Sollars | 526 | 20.4 | ||
| Majority | 250 | 9.9 | |||
| Turnout | 2,580 | ||||
| Liberal Democrats hold | Swing | ||||
| Party | Candidate | Votes | % | ±% | |
|---|---|---|---|---|---|
| Conservative | Daniel Husseini | 725 | 40.6 | ||
| Liberal Democrats | James Barratt | 714 | 40.0 | ||
| Green | David Faraday | 195 | 10.9 | ||
| Labour | Ben Knight | 151 | 8.5 | ||
| Majority | 11 | 0.6 | |||
| Turnout | 1,785 | ||||
| Conservative gain from Labour | Swing | ||||
Notes
- Includes totals for the predecessors of the Liberal Democrats, the Liberal Party and SDP (both of which participated in the Alliance).
- Includes totals for the predecessors of the Green Party of England and Wales, the Ecology Party and Green Party UK.