West Lothian Council elections
From Wikipedia, the free encyclopedia
Local government elections in West Lothian, Scotland
West Lothian Council in Scotland holds elections every five years, previously holding them every four years from its creation as a single-tier authority in 1995 to 2007.
As a district council
| Year | SNP | Labour | Conservative | Ratepayers | Independent |
|---|---|---|---|---|---|
| 1974 | 6 | 12 | 0 | 1 | 2 |
| 1977 | 9 | 9 | 0 | 2 | 1 |
| 1980 | 4 | 15 | 0 | 0 | 2 |
| 1984[a] | 2 | 19 | 0 | 2 | 1 |
| 1988 | 7 | 14 | 0 | 1 | 2 |
| 1992 | 11 | 10 | 2 | 0 | 1 |
As a unitary authority
| Year | SNP | Labour | Conservative | Liberal Democrats | Action to Save St John's Hospital | Independent |
|---|---|---|---|---|---|---|
| 1995 | 11 | 15 | 1 | 0 | 0 | 0 |
| 1999[a] | 11 | 20 | 1 | 0 | 0 | 0 |
| 2003 | 12 | 18 | 1 | 0 | 0 | 1 |
| 2007[b] | 13 | 14 | 1 | 0 | 3 | 1 |
| 2012 | 15 | 16 | 1 | 0 | 0 | 1 |
| 2017[c] | 13 | 12 | 7 | 0 | 0 | 1 |
| 2022 | 15 | 12 | 4 | 1 | 0 | 1 |
Results maps
 2003 results map
 2007 results map
 2012 results map
 2017 results map
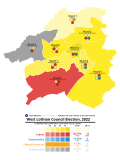 2022 results map


By-elections
2012-2017
| Party | Candidate | FPv% | Count | ||||
|---|---|---|---|---|---|---|---|
| 1 | 2 | 3 | 4 | ||||
| SNP | Sarah King | 43.4 | 1,620 | 1,647 | 1,676 | 1,874 | |
| Labour | Andrew McGuire | 27.0 | 1,009 | 1,018 | 1,074 | 1,382 | |
| Independent | Scott Mackay | 20.3 | 756 | 786 | 868 | ||
| Conservative | Ian Burgess | 6.8 | 255 | 264 | |||
| Green | Jenny Johnson | 2.4 | 90 | ||||
| SNP hold | |||||||
| Valid: 3,730 Spoilt: 46 Quota: 1,866 Turnout: 3,776 | |||||||
| Party | Candidate | FPv% | Count | |||||
|---|---|---|---|---|---|---|---|---|
| 1 | 2 | 3 | 4 | 5 | ||||
| SNP | David Tait | 43.1 | 2,049 | 2,061 | 2,099 | 2,234 | 2,325 | |
| Labour | David Manion | 22.9 | 1,088 | 1,131 | 1,175 | 1,279 | 1,644 | |
| Conservative | Ian Burgess | 20.5 | 973 | 992 | 1,056 | 1,070 | ||
| Green | Maire McCormack | 5.9 | 282 | 303 | 346 | |||
| Independent | Brenda Galloway | 4.8 | 230 | 246 | ||||
| Liberal Democrats | Caron Lindsay | 2.8 | 133 | |||||
| SNP hold | ||||||||
| Valid: 4,755 Spoilt: 28 Quota: 2,378 Turnout: 4,783 | ||||||||
2017-2022
| Party | Candidate | FPv% | Count | |||||||
|---|---|---|---|---|---|---|---|---|---|---|
| 1 | 2 | 3 | 4 | 5 | 6 | 7 | ||||
| SNP | Maria MacAulay | 43.9 | 2,465 | 2,467 | 2,496 | 2,603 | 2,703 | 2,763 | 3,370 | |
| Labour | Gordon Connolly | 24.6 | 1,382 | 1,384 | 1,419 | 1,481 | 1,579 | 2,098 | ||
| Conservative | Douglas Smith | 17.6 | 989 | 996 | 1,025 | 1,037 | 1,124 | |||
| Independent | Eddie Millar | 5.9 | 332 | 338 | 365 | 413 | ||||
| Green | Cameron Glasgow | 4.2 | 234 | 234 | 273 | |||||
| Liberal Democrats | Caron Lindsay | 3.3 | 185 | 186 | ||||||
| UKIP | John Mumford | 0.5 | 29 | |||||||
| SNP hold | ||||||||||
| Valid: 5,616 Spoilt: 52 Quota: 2,809 Turnout: 5,668 | ||||||||||
| Party | Candidate | FPv% | Count | |||||
|---|---|---|---|---|---|---|---|---|
| 1 | 2 | 3 | 4 | 5 | ||||
| SNP | Thomas Ullathorne | 42.5 | 1,890 | 1,906 | 1,918 | 2,122 | 2,368 | |
| Conservative | David Philip | 24.4 | 1,085 | 1,088 | 1,103 | 1,131 | 1,425 | |
| Labour | Danny Logue | 21.8 | 969 | 972 | 1,012 | 1,094 | ||
| Green | Neal Drummond | 7.6 | 336 | 343 | 377 | |||
| Liberal Democrats | Hans Edginton | 2.7 | 118 | 122 | ||||
| ISP | John Hannah | 1.1 | 47 | |||||
| SNP gain from Labour | ||||||||
| Valid: 4,445 Spoilt: 48 Quota: 2,223 Turnout: 4,493 | ||||||||
2022-2027
| Party | Candidate | FPv% | Count | ||||||||
|---|---|---|---|---|---|---|---|---|---|---|---|
| 1 | 2 | 3 | 4 | 5 | 6 | 7 | 8 | ||||
| Labour | Tony Boyle | 39.8 | 1,783 | 1,790 | 1,809 | 1,839 | 1,912 | 2,016 | 2,191 | 2,778 | |
| SNP | Thomas Ullathorne | 35.2 | 1,576 | 1,605 | 1,671 | 1,703 | 1,728 | 1,772 | 1,792 | ||
| Conservative | Douglas Smith | 7.8 | 347 | 348 | 349 | 354 | 381 | 458 | |||
| Independent | Chris Horne | 6.1 | 275 | 285 | 292 | 328 | 353 | ||||
| Liberal Democrats | Peter Clarke | 3.7 | 167 | 168 | 183 | 191 | |||||
| Independent | Steven Laidlaw | 2.8 | 125 | 132 | 136 | ||||||
| Green | Chris Cotter | 2.7 | 122 | 126 | |||||||
| Alba | Debbie Ewen | 1.8 | 29 | ||||||||
| Labour hold | |||||||||||
| Valid: 4,476 Spoilt: 24 Quota: 2,239 Turnout: 4,500 | |||||||||||
| Party | Candidate | FPv% | Count | |||||||
|---|---|---|---|---|---|---|---|---|---|---|
| 1 | 2 | 3 | 4 | 5 | 6 | 7 | ||||
| Labour | Susan Manion | 28.9 | 795 | 814 | 853 | 890 | 955 | 1,103 | 1,427 | |
| SNP | Keith Alan Barclay | 28.3 | 777 | 805 | 820 | 903 | 917 | 967 | ||
| Reform | David McLennan | 18.9 | 519 | 519 | 534 | 559 | 637 | |||
| Conservative | Douglas Smith | 8.2 | 226 | 227 | 248 | 272 | ||||
| ISP | John Hannah | 8.6 | 236 | 240 | 245 | |||||
| Liberal Democrats | Douglas Thomas Butler | 4.4 | 122 | 131 | ||||||
| Green | Adam William Rafferty | 2.7 | 73 | |||||||
| Labour gain from Independent | ||||||||||
| Electorate: 13,371 Valid: 2,748 Spoilt: 22 Quota: 1,375 Turnout: 2,770 | ||||||||||
| Party | Candidate | FPv% | Count | |||||||
|---|---|---|---|---|---|---|---|---|---|---|
| 1 | 2 | 3 | 4 | 5 | 6 | 7 | ||||
| Labour | David Russell | 30.9 | 1,093 | 1,108 | 1,126 | 1,164 | 1,283 | 1,424 | 1,778 | |
| SNP | Aileen Brown | 28.9 | 1,022 | 1,063 | 1,078 | 1,091 | 1,173 | 1,238 | ||
| Reform | David McLennan | 16.3 | 578 | 579 | 586 | 653 | 739 | |||
| Independent | Thomas Robert Lynch | 11.9 | 421 | 429 | 452 | 498 | ||||
| Conservative | Charles Kennedy | 6.7 | 239 | 239 | 259 | |||||
| Liberal Democrats | Douglas Thomas Butler | 2.7 | 97 | 111 | ||||||
| Green | Cameron Glasgow | 2.6 | 92 | |||||||
| Labour hold | ||||||||||
| Valid: 3,542 Spoilt: 35 Quota: 1,772 Turnout: 3,577 | ||||||||||
| Party | Candidate | FPv% | Count | |||||||
|---|---|---|---|---|---|---|---|---|---|---|
| 1 | 2 | 3 | 4 | 5 | 6 | 7 | ||||
| SNP | Mike Carlin | 31.8 | 1,375 | 1,428 | 1,504 | 1,550 | 1,571 | 1,672 | 2,126 | |
| Labour | June Andrews | 29.2 | 1,263 | 1,273 | 1,310 | 1,397 | 1,491 | 1,655 | ||
| Reform | David McLennan | 18.7 | 809 | 826 | 832 | 851 | 943 | |||
| Conservative | Mamie Taylor | 7.5 | 324 | 326 | 330 | 363 | ||||
| Liberal Democrats | Oliver Thomas Ferrario | 5.3 | 229 | 235 | 274 | |||||
| Green | Chris Cotter | 4.3 | 185 | 195 | ||||||
| Alba | Frank Anderson | 3.1 | 135 | |||||||
| SNP hold | ||||||||||
| Valid: 4,320 Spoilt: 37 Quota: 2,161 Turnout: 4,357 | ||||||||||
| Party | Candidate | FPv% | Count | ||||||||
|---|---|---|---|---|---|---|---|---|---|---|---|
| 1 | 2 | 3 | 4 | 5 | 6 | 7 | 8 | ||||
| Reform | David McLennan | 32.0 | 1,177 | 1,180 | 1,185 | 1,191 | 1,231 | 1,321 | 1,411 | 1,653 | |
| SNP | Callum Cox | 28.0 | 1,028 | 1,028 | 1,071 | 1,101 | 1,110 | 1,230 | 1,387 | ||
| Labour | Samual McCulloch | 17.1 | 627 | 631 | 636 | 655 | 683 | 762 | |||
| Independent | Thomas Robert Lynch | 13.2 | 484 | 497 | 505 | 530 | 549 | ||||
| Conservative | Reece Sinnott | 3.5 | 129 | 129 | 130 | 142 | |||||
| Liberal Democrats | Douglas Thomas Butler | 2.8 | 102 | 104 | 121 | ||||||
| Green | Robbie Gerald Walker | 2.7 | 101 | 102 | |||||||
| Independent | Eddie Millar | 0.7 | 27 | ||||||||
| Reform gain from Labour | |||||||||||
| Valid: 3,675 Spoilt: 44 Quota: 1,838 Turnout: 3,719 | |||||||||||
References
- ↑ "Initial Statutory Reviews of Electoral Arrangements". National Records of Scotland. Retrieved 6 March 2025.
- ↑ "Third Statutory Review of Electoral Arrangements - West Lothian Council Area" (PDF). Local Government Boundary Commission for Scotland. Retrieved 6 December 2025.
- ↑ "Fifth Statutory Review of Electoral Arrangements Final Recommendations - West Lothian Council Area" (PDF). Local Government Boundary Commission for Scotland. Retrieved 6 December 2025.
- ↑ "Armadale and Blackridge By-Election 26 March 2015 Results" (PDF). West Lothian Council. Retrieved 18 June 2021.
- ↑ "LINLITHGOW BY‐ELECTION on 1 OCTOBER 2015" (PDF). West Lothian Council. Retrieved 10 December 2025.
- ↑ "Preference Summary Report - Livingston South By-Election Results" (PDF). West Lothian Council. Retrieved 10 December 2025.
- ↑ "Preference Summary Report - East Livingston and East Calder By-Election Results" (PDF). West Lothian Council. Retrieved 10 December 2025.
- ↑ "Preference Summary Report - Broxburn, Uphall and Winchburgh By-Election Results" (PDF). West Lothian Council. Retrieved 10 December 2025.
- ↑ "Preference Summary Report - Ward 9 - Armadale and Blackridge" (PDF). West Lothian Council. Retrieved 12 November 2024.
- ↑ "Ward 7 - Whitburn and Blackburn Transfers Report" (PDF). West Lothian Council. Retrieved 27 October 2025.
- ↑ "Ward 2 - Broxburn Uphall and Winchburgh Transfers Report" (PDF). West Lothian Council. Retrieved 27 October 2025.
- ↑ "Ward 7 - Whitburn and Blackburn - Candidate Votes per Stage Report" (PDF). West Lothian Council. Retrieved 12 December 2025.