Westmont, New Jersey
From Wikipedia, the free encyclopedia
Westmont, New Jersey | |
|---|---|
 The former Westmont Theater, now a gym, is located on Haddon Avenue | |
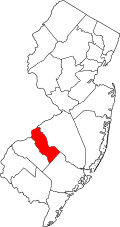
 Westmont Location in Camden County  Westmont Location in New Jersey  Westmont Location in the United States | |
| Coordinates: 39°54′30″N 75°03′19″W / 39.9082447°N 75.0551620°W | |
| Country | |
| State | |
| County | Camden |
| Township | Haddon |
| Area | |
• Total | 2.30 sq mi (5.96 km2) |
| • Land | 2.22 sq mi (5.76 km2) |
| • Water | 0.073 sq mi (0.19 km2) |
| Population | |
• Total | 13,726 |
| • Density | 6,170/sq mi (2,383/km2) |
| Time zone | UTC−05:00 (Eastern (EST)) |
| • Summer (DST) | UTC−04:00 (EDT) |
| ZIP Code | |
| Area code | 856 |
| FIPS code | 34-78410[4] |
| GNIS feature ID | 2806221[5] |
Westmont is an unincorporated community and census-designated place (CDP)[6] located within Haddon Township in Camden County, in the U.S. state of New Jersey.[7] The area is served as United States Postal Service ZIP Code 08108.[8] As of the 2020 census, Westmont had a population of 13,726.[9]
The downtown portion of the township is known as Westmont, a name probably derived from a noted harness racing horse.[10]
2020 census
| Census | Pop. | Note | %± |
|---|---|---|---|
| 2020 | 13,726 | — | |
| U.S. Decennial Census: 2020[11] | |||
Westmont first appeared as a census designated place in the 2020 U.S. census.[12]
As of the 2020 census, Westmont had a population of 13,726. The median age was 40.8 years. 20.0% of residents were under the age of 18 and 19.0% of residents were 65 years of age or older. For every 100 females there were 92.8 males, and for every 100 females age 18 and over there were 89.2 males age 18 and over.[13][14]
100.0% of residents lived in urban areas, while 0.0% lived in rural areas.[15]
There were 5,982 households in Westmont, of which 26.7% had children under the age of 18 living in them. Of all households, 46.9% were married-couple households, 17.3% were households with a male householder and no spouse or partner present, and 28.8% were households with a female householder and no spouse or partner present. About 33.0% of all households were made up of individuals and 16.1% had someone living alone who was 65 years of age or older.[13]
There were 6,286 housing units, of which 4.8% were vacant. The homeowner vacancy rate was 1.1% and the rental vacancy rate was 6.6%.[13]
| Race / Ethnicity (NH = Non-Hispanic) | Pop 2020[16] | 2020 |
|---|---|---|
| White alone (NH) | 11,924 | 86.87% |
| Black or African American alone (NH) | 295 | 2.15% |
| Native American or Alaska Native alone (NH) | 4 | 0.03% |
| Asian alone (NH) | 398 | 2.90% |
| Native Hawaiian or Pacific Islander alone (NH) | 2 | 0.01% |
| Other race alone (NH) | 43 | 0.31% |
| Mixed race or Multiracial (NH) | 404 | 2.94% |
| Hispanic or Latino (any race) | 656 | 4.78% |
| Total | 13,726 | 100.00% |