Winchester City Council elections
Local government elections in Hampshire, England
From Wikipedia, the free encyclopedia
Winchester City Council is responsible for the local government of the City of Winchester in Hampshire, England. Despite its name, the City of Winchester is a local government district that stretches far beyond the urban area of Winchester, covering urban, suburban and rural areas.
.jpg)
One third of Winchester City Council is elected each year in a sequence of three years, followed by one year without election, thus giving a tenure for individual councillors of four years. Since the last boundary changes in 2016, 45 councillors have been elected from 16 wards, there having previously been 57 councillors have been elected from 26 wards from 2002.[1]
Council composition
| Year | Conservative | Liberal Democrats[a] | Labour | Green | Independents & Others |
Council control after election | ||
|---|---|---|---|---|---|---|---|---|
| Local government reorganisation; council established (51 seats) | ||||||||
| 1973 | 14 | 5 | 5 | – | 27 | Independent | ||
| New ward boundaries (54 seats) | ||||||||
| 1976 | 24 | 3 | 4 | 0 | 23 | No overall control | ||
| 1979 | 36 | 2 | 4 | 0 | 12 | Conservative | ||
| 1980 | 35 | 2 | 5 | 0 | 12 | Conservative | ||
| 1982 | 35 | 5 | 5 | 0 | 9 | Conservative | ||
| 1983 | 36 | 5 | 5 | 0 | 8 | Conservative | ||
| 1984 | 37 | 7 | 5 | 0 | 5 | Conservative | ||
| 1986 | 32 | 14 | 5 | 0 | 4 | Conservative | ||
| 1987 | 25 | 23 | 5 | 0 | 2 | No overall control | ||
| 1988 | 26 | 22 | 5 | 0 | 2 | No overall control | ||
| 1990 | 27 | 22 | 6 | 0 | 0 | No overall control | ||
| 1991 | 26 | 23 | 6 | 0 | 0 | No overall control | ||
| 1992 | 23 | 22 | 6 | 0 | 4 | No overall control | ||
| 1994 | 16 | 29 | 6 | 0 | 4 | Liberal Democrats | ||
| 1995 | 12 | 33 | 6 | 0 | 4 | Liberal Democrats | ||
| 1996 | 9 | 36 | 6 | 0 | 4 | Liberal Democrats | ||
| 1998 | 10 | 37 | 4 | 0 | 4 | Liberal Democrats | ||
| 1973 | 12 | 34 | 4 | 0 | 5 | Liberal Democrats | ||
| 2000 | 10 | 36 | 4 | 0 | 5 | Liberal Democrats | ||
| New ward boundaries (57 seats) | ||||||||
| 2002 | 14 | 35 | 3 | 0 | 5 | Liberal Democrats | ||
| 2003 | 19 | 29 | 5 | 0 | 4 | Liberal Democrats | ||
| 2004 | 22 | 26 | 4 | 0 | 5 | No overall control | ||
| 2006 | 29 | 21 | 3 | 0 | 4 | Conservative | ||
| 2007 | 29 | 23 | 1 | 0 | 4 | Conservative | ||
| 2008 | 29 | 24 | 1 | 0 | 3 | Conservative | ||
| 2010 | 26 | 29 | 0 | 0 | 2 | Liberal Democrats | ||
| 2011 | 27 | 27 | 1 | 0 | 2 | No overall control | ||
| 2012 | 29 | 25 | 2 | 0 | 1 | Conservative | ||
| 2014 | 28 | 25 | 3 | 0 | 1 | No overall control | ||
| 2015 | 33 | 22 | 2 | 0 | 0 | Conservative | ||
| New ward boundaries (45 seats) | ||||||||
| 2016 | 25 | 20 | 0 | 0 | 0 | Conservative | ||
| 2018 | 23 | 22 | 0 | 0 | 0 | Conservative | ||
| 2019 | 18 | 27 | 0 | 0 | 0 | Liberal Democrats | ||
| 2021 | 16 | 27 | 0 | 0 | 2 | Liberal Democrats | ||
| 2022 | 15 | 27 | 0 | 1 | 2 | Liberal Democrats | ||
| 2023 | 12 | 30 | 0 | 2 | 1 | Liberal Democrats | ||
| 2024 | 8 | 33 | 0 | 3 | 1 | Liberal Democrats | ||
| 2026 | ||||||||
District result maps
 2002 results map
 2003 results map
 2004 results map
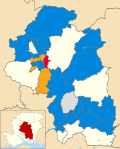 2006 results map
 2007 results map
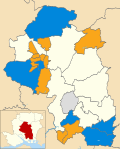 2008 results map
 2010 results map
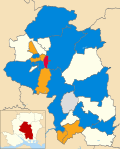 2011 results map
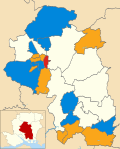 2012 results map
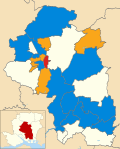 2014 results map
 2015 results map
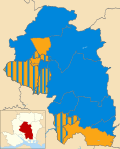 2016 results map (New Boundaries)
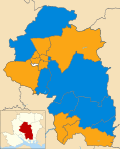 2018 results map
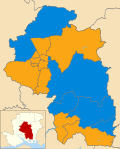 2019 results map
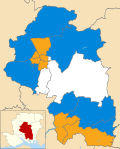 2021 results map
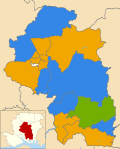 2022 results map
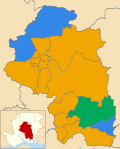 2023 results map
 2024 results map


N.b. White denotes no election held in ward that year
By-election results
1998–2002
| Party | Candidate | Votes | % | ±% | |
|---|---|---|---|---|---|
| Independent | Paul Hoare | 314 | 51.3 | −20.3 | |
| Conservative | Roger Huxstep | 145 | 23.7 | +23.7 | |
| Liberal Democrats | Margaret Scriven | 140 | 22.9 | +22.9 | |
| Labour | 13 | 2.1 | −13.5 | ||
| Majority | 169 | 27.6 | |||
| Turnout | 612 | 50.0 | |||
| Independent hold | Swing | ||||
| Party | Candidate | Votes | % | ±% | |
|---|---|---|---|---|---|
| Conservative | Malcolm Le May | 438 | 49.0 | +13.2 | |
| Liberal Democrats | Safia Boot | 404 | 45.2 | −13.4 | |
| Labour | Timothy Curran | 52 | 5.8 | +0.2 | |
| Majority | 34 | 3.8 | |||
| Turnout | 894 | 77 | |||
| Conservative gain from Liberal Democrats | Swing | ||||
2002–2006
| Party | Candidate | Votes | % | ±% | |
|---|---|---|---|---|---|
| Liberal Democrats | David Spender | 853 | 57.1 | −0.8 | |
| Conservative | Susan Evershed | 584 | 39.1 | +2.0 | |
| Labour | Clare McKenna | 56 | 3.7 | −1.3 | |
| Majority | 269 | 18.0 | |||
| Turnout | 1,493 | 46.3 | |||
| Liberal Democrats hold | Swing | ||||
2006–2010
| Party | Candidate | Votes | % | ±% | |
|---|---|---|---|---|---|
| Liberal Democrats | Angela Clear | 630 | 60.9 | −0.2 | |
| Conservative | Karen Jeffreys | 349 | 33.8 | −2.8 | |
| UKIP | Douglas Reed | 40 | 3.9 | +3.9 | |
| Labour | Robert Rudge | 15 | 1.5 | −0.8 | |
| Majority | 281 | 27.1 | |||
| Turnout | 1,034 | 33.0 | |||
| Liberal Democrats hold | Swing | ||||
| Party | Candidate | Votes | % | ±% | |
|---|---|---|---|---|---|
| Liberal Democrats | Daryl Henry | 1,180 | 54.1 | +1.1 | |
| Conservative | Sue Evershed | 938 | 43.0 | −1.6 | |
| Labour | Nicholas Carr | 64 | 2.9 | +0.5 | |
| Majority | 242 | 11.1 | |||
| Turnout | 2,182 | 51.0 | |||
| Liberal Democrats hold | Swing | ||||
2010–2014
| Party | Candidate | Votes | % | ±% | |
|---|---|---|---|---|---|
| Liberal Democrats | Robert Hutchison | 968 | 53.2 | −4.7 | |
| Conservative | Helen Osborne | 606 | 33.3 | −2.2 | |
| Labour | Nigel Fox | 247 | 13.6 | +7.0 | |
| Majority | 362 | 19.9 | |||
| Turnout | 1,821 | 32.4 | |||
| Liberal Democrats hold | Swing | ||||
| Party | Candidate | Votes | % | ±% | |
|---|---|---|---|---|---|
| Liberal Democrats | Brian Laming | 894 | 53.9 | −6.3 | |
| Conservative | Leanne Wheeler | 604 | 36.4 | +1.3 | |
| Labour | Hum Qureshi | 162 | 9.8 | +5.1 | |
| Majority | 290 | 17.5 | |||
| Turnout | 1,660 | 51.1 | |||
| Liberal Democrats hold | Swing | ||||
2018–2022
| Party | Candidate | Votes | % | ±% | |
|---|---|---|---|---|---|
| Conservative | Hugh Michael Rawson Lumby | 1039 | 51.6 | −18.0 | |
| Liberal Democrats | Lewis John North | 905 | 44.9 | +24.0 | |
| Labour | June Elizabeth Kershaw | 39 | 1.9 | −7.6 | |
| Green | Andrew Karl Wainwright | 31 | 1.5 | N/A | |
| Majority | 134 | ||||
| Conservative hold | Swing | ||||
2022–2026
| Party | Candidate | Votes | % | ±% | |
|---|---|---|---|---|---|
| Liberal Democrats | Richard Murphy | 2,217 | 48.3 | −5.4 | |
| Conservative | Leo Keay | 1,193 | 26.0 | −0.4 | |
| Green | Richard Needham | 795 | 17.3 | +4.2 | |
| Labour | Peter Marsh | 385 | 8.4 | +1.6 | |
| Majority | 1,024 | 22.3 | −4.9 | ||
| Turnout | 4,622 | 70.1 | +29.2 | ||
| Liberal Democrats hold | Swing | -2.9 | |||
| Party | Candidate | Votes | % | ±% | |
|---|---|---|---|---|---|
| Green | Liam Bailey-Morgan | 711 | 40.2 | +33.4 | |
| Conservative | Harry Johnson-Hill | 514 | 29.1 | +1.6 | |
| Liberal Democrats | Syed Nasser | 503 | 28.5 | −33.3 | |
| Labour | Alison Cochrane | 39 | 2.2 | −1.7 | |
| Majority | 197 | 11.1 | |||
| Turnout | 1,767 | ||||
| Green gain from Liberal Democrats | Swing | ||||
See also
- 1976 Winchester City Council election (New ward boundaries)[13]
- 1986 Winchester City Council election (City boundary changes took place but the number of seats remained the same)[14]
- 1998 Winchester City Council election
- 1999 Winchester City Council election
- 2000 Winchester City Council election
- 2002 Winchester City Council election (New ward boundaries increased the number of seats by 2)[15][16]
- 2003 Winchester City Council election
- 2004 Winchester City Council election
- 2006 Winchester City Council election
- 2007 Winchester City Council election
- 2008 Winchester City Council election
- 2010 Winchester City Council election
- 2011 Winchester City Council election
- 2012 Winchester City Council election
- 2014 Winchester City Council election
- 2015 Winchester City Council election
- 2016 Winchester City Council election (New ward boundaries)[17]
- 2018 Winchester City Council election
- 2019 Winchester City Council election
- 2021 Winchester City Council election
- 2022 Winchester City Council election
- 2023 Winchester City Council election
- 2024 Winchester City Council election
Notes
- Includes totals for the predecessors of the Liberal Democrats, the Liberal Party and SDP (both of which participated in the Alliance).