2010 London local elections
From Wikipedia, the free encyclopedia
Local government elections took place in London, and some other parts of the United Kingdom on Thursday 6 May 2010. Polling stations were open between 7am and 10pm.
.jpg)
6 May 2010
| |||||||||||||||||||||||||||||||||||||||||||||
All 1,861 on all 32 London boroughs | |||||||||||||||||||||||||||||||||||||||||||||
|---|---|---|---|---|---|---|---|---|---|---|---|---|---|---|---|---|---|---|---|---|---|---|---|---|---|---|---|---|---|---|---|---|---|---|---|---|---|---|---|---|---|---|---|---|---|
| Turnout | 62.0% ( | ||||||||||||||||||||||||||||||||||||||||||||
| |||||||||||||||||||||||||||||||||||||||||||||
 London borough councils by political control following election. Councils that are Labour are in red, Conservative in blue, Liberal Democrat in yellow and no overall control in black. | |||||||||||||||||||||||||||||||||||||||||||||

.jpg)
Despite losing 6 Parliamentary seats in London in the General Election conducted on the same day, London Labour's share of the vote, council seats and control of Councils rose substantially. 10 councils swung to Labour control, and the party gained 190 council seats. Support for the London Conservatives in the capital declined by 3%, with the party losing 3 councils and 68 councillors. The London Liberal Democrats increased their vote share slightly but lost 70 councillors, as well as losing control of Richmond upon Thames council to the Conservatives.
The success of minor parties in the 2006 elections was not repeated, and the smaller parties were almost wiped out. The British National Party, Christian Peoples Alliance and Socialist Party lost all of their seats, while the London Green Party lost 10 of their 12 seats and Respect lost 14 out of 15. In total, 21 candidates from minor parties were elected, 43 fewer than in 2006.
All London borough council seats were up for election. Mayoral contests were also held in the London Boroughs of Hackney, Lewisham, and Newham. The previous Borough elections in London were in 2006.
Results summary
| Party[1] | Votes won | % votes | Change | Seats | % seats | Change | Councils | Change | |
|---|---|---|---|---|---|---|---|---|---|
| Labour | 1,213,983 | 32.5 | +4.6 | 875 | 47.0 | +191 | 17 | +10 | |
| Conservative | 1,184,352 | 31.7 | -3.2 | 717 | 38.5 | -68 | 11 | -3 | |
| Liberal Democrats | 835,217 | 22.4 | +1.7 | 246 | 13.2 | -70 | 2 | -1 | |
| Green | 248,175 | 6.6 | -1.3 | 2 | 0.1 | -10 | 0 | ±0 | |
| Others | 251,562 | 6.8 | -1.8 | 21 | 1.1 | -43 | 0 | ±0 | |
| No overall control | n/a | n/a | n/a | n/a | n/a | n/a | 2 | -6 | |
- Turnout: 3,502,273 voters cast ballots, a turnout of 62.0% (+24.1%).[2]
Council results
Mayoral results
In three London boroughs the executive function of the council is a directly elected mayor. The mayoral elections take place at the same time as councillor elections in those boroughs.
| Mayoralty | 2006 | 2010 | ||
|---|---|---|---|---|
| Hackney | Jules Pipe (Labour) | Jules Pipe (Labour) | ||
| Lewisham | Sir Steve Bullock (Labour) | Sir Steve Bullock (Labour) | ||
| Newham | Robin Wales (Labour) | Robin Wales (Labour) | ||
Ward result maps
London-wide
The map below shows the results for each ward across the whole of Greater London.

By borough
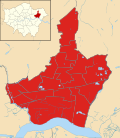 Barking and Dagenham 2010 results map
 Barnet 2010 results map
 Bexley 2010 results map
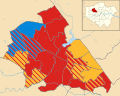 Brent 2010 results map
 Bromley 2010 results map
 Camden 2010 results map
 Croydon 2010 results map
 Ealing 2010 results map
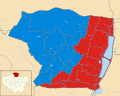 Enfield 2010 results map
 Greenwich 2010 results map
 Hackney 2010 results map
 Hammersmith and Fulham 2010 results map
 Haringey 2010 results map
 Harrow 2010 results map
 Havering 2010 results map
 Hillingdon 2010 results map
 Hounslow 2010 results map
 Islington 2010 results map
 Kensington and Chelsea 2010 results map
 Kingston upon Thames 2010 results map
 Lambeth 2010 results map
 Lewisham 2010 results map
 Merton 2010 results map
 Newham 2010 results map
 Redbridge 2010 results map
 Richmond upon Thames 2010 results map
 Southwark 2010 results map
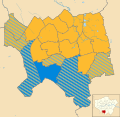 Sutton 2010 results map
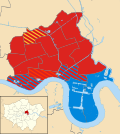 Tower Hamlets 2010 results map
 Waltham Forest 2010 results map
 Wandsworth 2010 results map
 Westminster 2010 results map


