Capulin, New Mexico
From Wikipedia, the free encyclopedia
Capulin, New Mexico | |
|---|---|
Census-designated place | |
 Capulin viewed from nearby Capulin Volcano | |
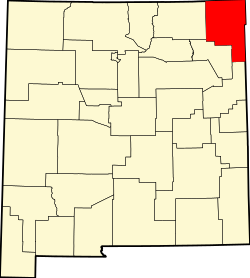
 Capulin  Capulin | |
| Coordinates: 36°44′56″N 103°59′45″W / 36.74889°N 103.99583°W | |
| Country | United States |
| State | New Mexico |
| County | Union |
| Area | |
• Total | 1.48 sq mi (3.84 km2) |
| • Land | 1.48 sq mi (3.84 km2) |
| • Water | 0 sq mi (0.00 km2) |
| Elevation | 6,824 ft (2,080 m) |
| Population | |
• Total | 61 |
| • Density | 41.1/sq mi (15.87/km2) |
| Time zone | UTC-7 (Mountain (MST)) |
| • Summer (DST) | UTC-6 (MDT) |
| ZIP code | 88414 |
| Area code | 575 |
| GNIS feature ID | 2584068[2] |
Capulin is a census-designated place and unincorporated community in Union County, New Mexico, United States. As of the 2020 census, Capulin had a population of 61.[4] Capulin had a post office until August 13, 2011; it still has its own ZIP code, 88414.[5][6] U.S. routes 64 and 87 pass through the community.
It was known as Dedman from 1909 to 1922, after railroad superintendent E.J. Dedman.[7]
Geography
Capulin Volcano National Monument is located 5 kilometres (3.1 miles) north of Capulin. The town was named after the volcano by Hispanic settlers after the Civil War.
Climate
| Climate data for Capulin, New Mexico, 1991–2020 normals, extremes 1995–present | |||||||||||||
|---|---|---|---|---|---|---|---|---|---|---|---|---|---|
| Month | Jan | Feb | Mar | Apr | May | Jun | Jul | Aug | Sep | Oct | Nov | Dec | Year |
| Record high °F (°C) | 70 (21) |
75 (24) |
82 (28) |
86 (30) |
93 (34) |
100 (38) |
97 (36) |
95 (35) |
94 (34) |
87 (31) |
80 (27) |
71 (22) |
100 (38) |
| Mean maximum °F (°C) | 62.6 (17.0) |
65.5 (18.6) |
74.4 (23.6) |
79.1 (26.2) |
84.5 (29.2) |
93.7 (34.3) |
93.8 (34.3) |
90.7 (32.6) |
87.9 (31.1) |
81.4 (27.4) |
73.7 (23.2) |
64.5 (18.1) |
94.9 (34.9) |
| Mean daily maximum °F (°C) | 46.1 (7.8) |
48.8 (9.3) |
56.7 (13.7) |
64.1 (17.8) |
73.6 (23.1) |
82.6 (28.1) |
85.6 (29.8) |
82.8 (28.2) |
77.4 (25.2) |
66.9 (19.4) |
54.5 (12.5) |
45.9 (7.7) |
65.4 (18.6) |
| Daily mean °F (°C) | 30.5 (−0.8) |
33.4 (0.8) |
40.5 (4.7) |
47.7 (8.7) |
56.6 (13.7) |
65.9 (18.8) |
69.8 (21.0) |
67.7 (19.8) |
61.7 (16.5) |
50.1 (10.1) |
38.4 (3.6) |
30.1 (−1.1) |
49.4 (9.7) |
| Mean daily minimum °F (°C) | 14.9 (−9.5) |
18.0 (−7.8) |
24.3 (−4.3) |
31.2 (−0.4) |
39.5 (4.2) |
49.1 (9.5) |
54.0 (12.2) |
52.6 (11.4) |
46.0 (7.8) |
33.2 (0.7) |
22.3 (−5.4) |
14.4 (−9.8) |
33.3 (0.7) |
| Mean minimum °F (°C) | −6.9 (−21.6) |
−3.5 (−19.7) |
2.6 (−16.3) |
16.2 (−8.8) |
23.9 (−4.5) |
37.7 (3.2) |
46.9 (8.3) |
44.6 (7.0) |
32.0 (0.0) |
16.1 (−8.8) |
2.7 (−16.3) |
−5.2 (−20.7) |
−12.4 (−24.7) |
| Record low °F (°C) | −17 (−27) |
−24 (−31) |
−12 (−24) |
6 (−14) |
13 (−11) |
28 (−2) |
34 (1) |
38 (3) |
22 (−6) |
−2 (−19) |
−13 (−25) |
−20 (−29) |
−24 (−31) |
| Average precipitation inches (mm) | 0.51 (13) |
0.50 (13) |
0.98 (25) |
0.96 (24) |
1.46 (37) |
2.31 (59) |
3.60 (91) |
2.87 (73) |
1.93 (49) |
1.10 (28) |
0.62 (16) |
0.76 (19) |
17.60 (447) |
| Average snowfall inches (cm) | 6.4 (16) |
5.4 (14) |
7.7 (20) |
4.6 (12) |
0.7 (1.8) |
0.0 (0.0) |
0.0 (0.0) |
0.0 (0.0) |
0.0 (0.0) |
2.4 (6.1) |
4.6 (12) |
9.1 (23) |
40.9 (104.9) |
| Average precipitation days (≥ 0.01 in) | 4.6 | 4.8 | 5.8 | 6.1 | 7.4 | 9.5 | 12.8 | 11.2 | 6.6 | 5.0 | 3.7 | 4.8 | 82.3 |
| Average snowy days (≥ 0.1 in) | 3.9 | 2.9 | 3.5 | 2.1 | 0.3 | 0.0 | 0.0 | 0.0 | 0.0 | 1.0 | 2.0 | 4.4 | 20.1 |
| Source 1: NOAA[8] | |||||||||||||
| Source 2: National Weather Service (mean maxima/minima 2006–2020)[9] | |||||||||||||