Castanheira de Pera
Municipality in Centro, Portugal
From Wikipedia, the free encyclopedia
Castanheira de Pera (Portuguese pronunciation: [kɐʃtɐˈɲɐjɾɐ ðɨ ˈpeɾɐ] ⓘ), often erroneously written Castanheira de Pêra, is a Portuguese municipality in the historical Beira Litoral province, in Central Region and district of Leiria. The population in 2011 was 3,191,[1] in an area of 66.77 km².[2]
_(cropped).jpg)
Castanheira de Pera | |
|---|---|
| |
 Flag  Coat of arms | |
 Interactive map of Castanheira de Pera | |
 Castanheira de Pera Location in Portugal | |
| Coordinates: 40°00′N 8°13′W | |
| Country | |
| Region | Centro |
| Intermunic. comm. | Região de Leiria |
| District | Leiria |
| Parishes | 1 |
| Government | |
| • President | Fernando José Pires Lopes (PS) |
| Area | |
• Total | 66.77 km2 (25.78 sq mi) |
| Population (2011) | |
• Total | 3,191 |
| • Density | 47.79/km2 (123.8/sq mi) |
| Time zone | UTC+00:00 (WET) |
| • Summer (DST) | UTC+01:00 (WEST) |
| Local holiday | July 4 |
| Website | http://www.cm-castanheiradepera.pt |
The present Mayor is Fernando José Pires Lopes, elected by the Socialist Party. The municipal holiday is on July 4.
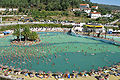 Roca's Beach
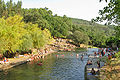 Corga
Corga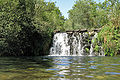 Véras
Véras St. António da Neve


Parishes
Climate
| Climate data for Castanheira de Pera, 1934-1960 normals, 1981-2021 precipitation | |||||||||||||
|---|---|---|---|---|---|---|---|---|---|---|---|---|---|
| Month | Jan | Feb | Mar | Apr | May | Jun | Jul | Aug | Sep | Oct | Nov | Dec | Year |
| Mean daily maximum °C (°F) | 13.7 (56.7) |
15.3 (59.5) |
17.7 (63.9) |
20.7 (69.3) |
22.4 (72.3) |
26.9 (80.4) |
30.2 (86.4) |
30.7 (87.3) |
28.2 (82.8) |
23.2 (73.8) |
17.9 (64.2) |
14.4 (57.9) |
21.8 (71.2) |
| Daily mean °C (°F) | 8.9 (48.0) |
9.9 (49.8) |
12.2 (54.0) |
14.6 (58.3) |
16.2 (61.2) |
19.9 (67.8) |
22.4 (72.3) |
22.7 (72.9) |
20.8 (69.4) |
17.0 (62.6) |
12.6 (54.7) |
9.4 (48.9) |
15.6 (60.0) |
| Mean daily minimum °C (°F) | 4.1 (39.4) |
4.5 (40.1) |
6.8 (44.2) |
8.4 (47.1) |
10.0 (50.0) |
12.9 (55.2) |
14.5 (58.1) |
14.7 (58.5) |
13.4 (56.1) |
10.7 (51.3) |
7.4 (45.3) |
4.4 (39.9) |
9.3 (48.8) |
| Average precipitation mm (inches) | 207.2 (8.16) |
174.8 (6.88) |
103.1 (4.06) |
155.8 (6.13) |
144.5 (5.69) |
52.1 (2.05) |
11.5 (0.45) |
16.3 (0.64) |
60.1 (2.37) |
175.9 (6.93) |
195.9 (7.71) |
231.6 (9.12) |
1,528.8 (60.19) |
| Average relative humidity (%) | 80 | 76 | 72 | 68 | 69 | 60 | 60 | 60 | 65 | 72 | 78 | 80 | 70 |
| Source: Portuguese Environment Agency[4][5] | |||||||||||||
Notable people
- Kalidás Barreto (1932–2020) a Portuguese accountant and trade unionist; active in Castanheira de Pera where he died
- João Carvalho (born 1997) a Portuguese footballer with nearly 200 club caps, he plays for Nottingham Forest F.C.