Hettinger County, North Dakota
County in North Dakota, United States
From Wikipedia, the free encyclopedia
Hettinger County (/ˈhɛtɪŋɡər/ HET-ing-gər) is a county in the U.S. state of North Dakota. As of the 2020 census, the population was 2,489.[1] The county seat is Mott and the largest city is New England.[2]

 United States
April 19, 1907 (organized)
Hettinger County, North Dakota | |
|---|---|
The Hettinger County Courthouse in Mott | |
 Location within the U.S. state of North Dakota | |
| Coordinates: 46.435704°N 102.454238°W | |
| Country | United States |
| State |  North Dakota North Dakota |
| Founded | March 9, 1883 (created) April 19, 1907 (organized) |
| Named after | Mathias Hettinger |
| Seat | Mott |
| Largest city | New England |
| Area | |
• Total | 1,133.787 sq mi (2,936.49 km2) |
| • Land | 1,132.239 sq mi (2,932.49 km2) |
| • Water | 1.548 sq mi (4.01 km2) 0.14% |
| Population (2020) | |
• Total | 2,489 |
• Estimate (2025) | 2,492  |
| • Density | 2.136/sq mi (0.825/km2) |
| Time zone | UTC−7 (Mountain) |
| • Summer (DST) | UTC−6 (MDT) |
| Area code | 701 |
| Congressional district | At-large |
| Website | hettingercountynd.com |
The city of Hettinger, North Dakota is the seat of neighbouring Adams County, which lies directly to the south and was part of Hettinger County until 1907.
History
The Dakota Territory legislature created the county on March 9, 1883, with territory partitioned from Stark County. Its government was not organized at that time. The county name was chosen by territorial legislator Erastus A. Williams, to honor his father-in-law, Mathias K. Hettinger (1810–1890), who had been a banker and public figure in Freeport, Illinois. Mott, on the Cannonball River, was selected as the county seat.
The county boundaries were reduced in 1885 and 1887. The county was dissolved on November 3, 1896, but was re-created on May 24, 1901, by an action of the state supreme court. This re-creation slightly altered the county's boundaries, due to the redefinition of its boundary lines: a sliver of non-county area between 46°N latitude and the south boundary line of North Dakota was added; a sliver on the west boundary was lost when the definition of the line shifted from 103°W longitude to the survey line dividing Ranges 98 and 99 (to allow the county lines to be defined by federally-surveyed lines).
Since the county's government was still unorganized, it was attached to Stark County for administrative and judicial purposes on March 10, 1903.
On April 17, 1907, the southern half of the county was partitioned off to form Adams County. On April 19 the Hettinger County governmental organization was effected and the county was administratively detached from Stark County.
Efforts to dissolve Hettinger County
In 1891, the North Dakota Legislature approved legislation to dissolve Hettinger County and add its territory to Stark County,[3][4] but the law was vetoed by Governor Eli C. D. Shortridge.[5][6]
Annexation was attempted a second time in 1895, when the legislature passed legislation expanding the boundaries of Stark, Billings and Mercer Counties, subject to approval by the counties' voters.[7] The vote was approved, annexation went into effect November 3, 1896, and Hettinger County was eliminated.[5] However, Wilson L. Richards, a cattle rancher in one of the annexed counties, sued to overturn the annexation because he and other landowners were now subject to taxation by Stark County. The case went to the North Dakota Supreme Court, which ruled the law unconstitutional on May 18, 1899.[6][8][9] The annexation remained in effect, however, due to a replacement law approved by the legislature March 9, 1899 in anticipation of the court's decision.[5][10] The second annexation law was overturned by the Supreme Court in 1901 because the annexation was not referred to the voters of the affected counties as required by the North Dakota Constitution.[11][12]

The Legislature passed a third annexation law in 1903, this time submitting it to the voters in Stark County and the unorganized counties of Dunn and Hettinger for approval.[13] The annexation was approved by 502 votes in Stark County and 65 votes in Hettinger County, but it failed by 1 vote in Dunn County.[14] Stark County claimed the annexation vote valid, since the legislation required a majority of the aggregate votes cast. However, the North Dakota Constitution required a majority vote in each affected county subject to annexation, so the state of North Dakota sued Stark County on the grounds that the enabling legislation was unconstitutional and that the "no" vote in Dunn County meant the annexation failed. The North Dakota Supreme Court ruled the 1903 law unconstitutional in 1905, which ended further attempts at annexation.[14]
Geography
The Cannonball River flows east-southeasterly through the central part of the county. The county terrain consists of semi-arid rolling hills, mostly devoted to agriculture.[15] The terrain slopes to the east and south; its highest point is a hill at the northwestern corner, at 2,897 ft (883 m) ASL.[16] The county has a total area of 1,134 square miles (2,940 km2), of which 1,132 square miles (2,930 km2) is land and 1.6 square miles (4.1 km2) (0.1%) is water.[17]
Major highways
.svg)
.svg)
.svg)
Adjacent counties
- Stark County (north)
- Grant County (east)
- Adams County (south)
- Slope County (west)
Lakes
Source:[15]
- Dry Lake
- Jung Lake
- Larson Lake
Demographics
| Census | Pop. | Note | %± |
|---|---|---|---|
| 1910 | 6,557 | — | |
| 1920 | 7,685 | 17.2% | |
| 1930 | 8,796 | 14.5% | |
| 1940 | 7,457 | −15.2% | |
| 1950 | 7,100 | −4.8% | |
| 1960 | 6,317 | −11.0% | |
| 1970 | 5,075 | −19.7% | |
| 1980 | 4,275 | −15.8% | |
| 1990 | 3,445 | −19.4% | |
| 2000 | 2,715 | −21.2% | |
| 2010 | 2,477 | −8.8% | |
| 2020 | 2,489 | 0.5% | |
| 2025 (est.) | 2,492 | [18] | 0.1% |
| U.S. Decennial Census[19] 1790–1960[20] 1900–1990[21] 1990–2000[22] 2010–2020[1] | |||
Housing
As of the fourth quarter of 2024, the median home value in Hettinger County was $117,505.[23]
2020 census
As of the 2020 census, the county had a population of 2,489.[24]
Of the residents, 21.9% were under the age of 18 and 25.6% were 65 years of age or older; the median age was 47.4 years. For every 100 females there were 98.5 males, and for every 100 females age 18 and over there were 95.5 males.[25]
The racial makeup of the county was 93.5% White, 0.2% Black or African American, 1.8% American Indian and Alaska Native, 0.3% Asian, 0.4% from some other race, and 3.5% from two or more races. Hispanic or Latino residents of any race comprised 1.4% of the population.[24]
There were 1,064 households in the county, of which 24.2% had children under the age of 18 living with them and 19.2% had a female householder with no spouse or partner present. About 33.2% of all households were made up of individuals and 18.6% had someone living alone who was 65 years of age or older.[25]
There were 1,399 housing units, of which 23.9% were vacant. Among occupied housing units, 80.5% were owner-occupied and 19.5% were renter-occupied. The homeowner vacancy rate was 1.9% and the rental vacancy rate was 20.6%.[25]
2010 census
As of the census of 2010, there were 2,477 people, 1,056 households, and 682 families in the county. The population density was 2.2 inhabitants per square mile (0.85/km2). There were 1,414 housing units at an average density of 1.2 units per square mile (0.46/km2). The racial makeup of the county was 96.2% white, 2.1% American Indian, 0.2% black or African American, 0.1% Pacific islander, 0.0% from other races, and 1.3% from two or more races. Those of Hispanic or Latino origin made up 0.5% of the population. In terms of ancestry, 71.1% were German, 15.8% were Norwegian, 6.1% were Russian, 5.9% were Czech, 5.4% were Irish, 5.3% were Hungarian, and 3.2% were American.
Of the 1,056 households, 22.4% had children under the age of 18 living with them, 57.6% were married couples living together, 4.5% had a female householder with no husband present, 35.4% were non-families, and 33.1% of all households were made up of individuals. The average household size was 2.19 and the average family size was 2.75. The median age was 49.4 years.
The median income for a household in the county was $38,393 and the median income for a family was $49,605. Males had a median income of $33,155 versus $26,549 for females. The per capita income for the county was $24,928. About 8.2% of families and 11.0% of the population were below the poverty line, including 9.3% of those under age 18 and 13.1% of those age 65 or over.
Population by decade

Communities
Cities
- Mott (county seat)
- New England
- Regent
Unincorporated community
Townships
Defunct townships
Source:[26]
- Alden
- Indian Creek Township
Politics
Hettinger County voters have traditionally voted Republican. In only one national election since 1936 has the county selected the Democratic Party candidate.
| Year | Republican | Democratic | Third party(ies) | |||
|---|---|---|---|---|---|---|
| No. | % | No. | % | No. | % | |
| 1908 | 568 | 73.96% | 181 | 23.57% | 19 | 2.47% |
| 1912 | 442 | 37.71% | 381 | 32.51% | 349 | 29.78% |
| 1916 | 856 | 53.67% | 661 | 41.44% | 78 | 4.89% |
| 1920 | 1,849 | 83.44% | 327 | 14.76% | 40 | 1.81% |
| 1924 | 936 | 39.73% | 128 | 5.43% | 1,292 | 54.84% |
| 1928 | 1,553 | 53.87% | 1,323 | 45.89% | 7 | 0.24% |
| 1932 | 921 | 27.43% | 2,336 | 69.57% | 101 | 3.01% |
| 1936 | 989 | 29.82% | 1,383 | 41.69% | 945 | 28.49% |
| 1940 | 2,468 | 78.32% | 671 | 21.29% | 12 | 0.38% |
| 1944 | 1,812 | 76.42% | 554 | 23.37% | 5 | 0.21% |
| 1948 | 1,517 | 64.33% | 752 | 31.89% | 89 | 3.77% |
| 1952 | 2,330 | 87.79% | 297 | 11.19% | 27 | 1.02% |
| 1956 | 1,882 | 70.17% | 796 | 29.68% | 4 | 0.15% |
| 1960 | 1,541 | 55.79% | 1,219 | 44.13% | 2 | 0.07% |
| 1964 | 1,188 | 48.19% | 1,275 | 51.72% | 2 | 0.08% |
| 1968 | 1,424 | 63.97% | 638 | 28.66% | 164 | 7.37% |
| 1972 | 1,511 | 64.93% | 726 | 31.20% | 90 | 3.87% |
| 1976 | 1,135 | 49.30% | 1,095 | 47.57% | 72 | 3.13% |
| 1980 | 1,699 | 75.28% | 434 | 19.23% | 124 | 5.49% |
| 1984 | 1,646 | 74.75% | 524 | 23.80% | 32 | 1.45% |
| 1988 | 1,395 | 66.08% | 698 | 33.06% | 18 | 0.85% |
| 1992 | 854 | 46.46% | 465 | 25.30% | 519 | 28.24% |
| 1996 | 765 | 53.65% | 418 | 29.31% | 243 | 17.04% |
| 2000 | 1,057 | 69.59% | 353 | 23.24% | 109 | 7.18% |
| 2004 | 1,044 | 69.88% | 405 | 27.11% | 45 | 3.01% |
| 2008 | 893 | 66.25% | 406 | 30.12% | 49 | 3.64% |
| 2012 | 1,000 | 73.42% | 313 | 22.98% | 49 | 3.60% |
| 2016 | 1,050 | 81.02% | 168 | 12.96% | 78 | 6.02% |
| 2020 | 1,091 | 83.16% | 196 | 14.94% | 25 | 1.91% |
| 2024 | 1,089 | 83.38% | 192 | 14.70% | 25 | 1.91% |
See also
Gallery
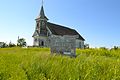
 Church building in Bentley