Results of the 1936 Swedish general election
From Wikipedia, the free encyclopedia
Sweden 1936 election: General election
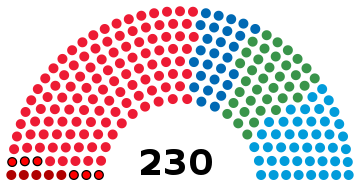
Sweden held a general election on 20 September 1936.[1][2]
 |
|---|
| Party | Votes | % | Seats | +/– |
|---|
| Swedish Social Democratic Party | 1,338,120 | 45.86 | 112 | +8 |
| General Electoral League | 512,781 | 17.57 | 44 | –14 |
| Farmers' League | 418,840 | 14.35 | 36 | 0 |
| People's Party | 376,161 | 12.89 | 27 | +3 |
| Socialist Party | 127,832 | 4.38 | 6 | 0 |
| Communist Party | 96,519 | 3.31 | 5 | +3 |
| National League | 26,750 | 0.92 | 0 | New |
| National Socialist Workers' Party | 17,483 | 0.60 | 0 | New |
| Swedish National Socialist Party | 3,025 | 0.10 | 0 | 0 |
| Other parties | 242 | 0.01 | 0 | 0 |
| Total | 2,917,753 | 100.00 | 230 | 0 |
|
| Valid votes | 2,917,753 | 99.73 | |
|---|
| Invalid/blank votes | 8,023 | 0.27 | |
|---|
| Total votes | 2,925,776 | 100.00 | |
|---|
| Registered voters/turnout | 3,924,598 | 74.55 | |
|---|
| Source: Nohlen & Stöver, SCB |
| Location |
Share |
Votes |
S |
AV |
B |
FP |
SP |
K |
Other |
Left |
Right |
|---|
| Götaland |
49.8 |
1,451,665 |
44.4 |
19.4 |
18.7 |
11.2 |
1.6 |
2.8 |
1.9 |
48.8 |
49.3 |
| Svealand |
34.4 |
1,003,572 |
47.4 |
16.5 |
9.2 |
15.0 |
8.5 |
4.8 |
1.2 |
58.1 |
40.7 |
| Norrland |
15.9 |
462,516 |
47.3 |
14.1 |
12.0 |
13.6 |
4.2 |
7.1 |
1.6 |
58.7 |
39.7 |
| Total |
100.0 |
2,917,753 |
45.9 |
17.6 |
14.4 |
12.9 |
4.4 |
3.3 |
1.6 |
53.6 |
44.8 |
| Source: SCB [1] |
| Location |
Share |
Votes |
S |
AV |
B |
FP |
SP |
K |
Other |
Left |
Right |
|---|
| Götaland |
49.8 |
1,451,665 |
644,168 |
281,736 |
270,739 |
162,750 |
23,337 |
40,797 |
28,138 |
708,302 |
715,225 |
| Svealand |
34.4 |
1,003,572 |
475,214 |
165,723 |
92,765 |
150,467 |
84,887 |
22,720 |
11,796 |
582,821 |
408,955 |
| Norrland |
15.9 |
462,516 |
218,738 |
65,322 |
55,336 |
62,944 |
19,608 |
33,002 |
7,566 |
271,348 |
183,602 |
| Total |
100.0 |
2,917,753 |
1,338,120 |
512,781 |
418,840 |
376,161 |
127,832 |
96,519 |
47,500 |
1,562,471 |
1,307,782 |
| Source: SCB [1] |
| Location |
Land |
Share |
Votes |
S |
AV |
B |
FP |
SP |
K |
Other |
|
|
Margin |
|---|
|
|
|
|
|
|
|
|
|
|
|
|
|
|
% |
|
% |
% |
% |
% |
% |
% |
% |
% |
% |
|
| Blekinge |
G |
2.1 |
60,941 |
46.6 |
21.5 |
13.0 |
12.3 |
1.7 |
3.0 |
1.9 |
51.4 |
46.8 |
2,809 |
| Bohuslän |
G |
3.1 |
90,989 |
41.9 |
23.1 |
16.9 |
11.2 |
1.5 |
3.5 |
1.8 |
46.9 |
51.2 |
3,903 |
| Gothenburg |
G |
4.3 |
126,844 |
43.3 |
24.2 |
0.0 |
10.3 |
5.6 |
12.6 |
4.0 |
61.4 |
34.5 |
34,121 |
| Gotland |
G |
1.0 |
28,222 |
32.8 |
13.8 |
37.9 |
13.1 |
0.3 |
0.4 |
1.7 |
33.5 |
64.8 |
8,827 |
| Gävleborg |
N |
4.1 |
118,894 |
49.4 |
9.8 |
13.4 |
11.4 |
10.2 |
5.2 |
0.6 |
64.8 |
34.6 |
35,854 |
| Halland |
G |
2.4 |
71,321 |
36.3 |
20.3 |
34.4 |
3.6 |
1.1 |
2.2 |
2.1 |
39.6 |
58.2 |
13,273 |
| Jämtland |
N |
1.9 |
56,077 |
50.0 |
18.1 |
13.2 |
14.9 |
0.8 |
2.5 |
0.5 |
53.3 |
46.2 |
3,968 |
| Jönköping |
G |
3.9 |
115,178 |
37.4 |
12.6 |
20.9 |
25.0 |
1.6 |
1.9 |
0.6 |
40.9 |
58.5 |
20,257 |
| Kalmar |
G |
3.6 |
104,044 |
41.6 |
20.9 |
26.0 |
6.6 |
0.4 |
3.0 |
1.4 |
45.0 |
53.6 |
8,975 |
| Kopparberg |
S |
3.8 |
110,643 |
47.4 |
8.6 |
13.1 |
17.0 |
12.1 |
1.4 |
0.4 |
60.9 |
38.7 |
24,513 |
| Kristianstad |
G |
3.7 |
109,063 |
42.7 |
15.5 |
23.6 |
14.9 |
0.3 |
1.2 |
1.7 |
44.2 |
54.0 |
10,684 |
| Kronoberg |
G |
2.4 |
70,426 |
36.5 |
21.3 |
27.4 |
8.3 |
1.8 |
3.6 |
1.1 |
41.9 |
57.0 |
10,606 |
| Malmö area |
G |
4.5 |
130,644 |
62.5 |
22.3 |
1.7 |
6.7 |
0.8 |
1.2 |
4.8 |
64.5 |
30.7 |
44,191 |
| Malmöhus |
G |
4.6 |
135,506 |
51.1 |
11.3 |
25.3 |
9.7 |
1.0 |
0.4 |
1.2 |
52.6 |
46.2 |
8,606 |
| Norrbotten |
N |
2.5 |
74,072 |
40.2 |
14.9 |
9.1 |
6.5 |
0.7 |
22.2 |
6.4 |
63.1 |
30.5 |
24,186 |
| Skaraborg |
G |
3.9 |
112,539 |
34.6 |
20.7 |
26.3 |
14.4 |
1.2 |
1.7 |
1.0 |
37.6 |
61.4 |
26,789 |
| Stockholm |
S |
10.1 |
296,091 |
42.1 |
25.7 |
1.0 |
15.5 |
10.1 |
3.2 |
2.4 |
55.4 |
42.2 |
39,166 |
| Stockholm County |
S |
4.4 |
129,368 |
46.8 |
18.0 |
9.6 |
13.1 |
9.2 |
2.1 |
1.2 |
58.1 |
40.7 |
22,515 |
| Södermanland |
S |
3.2 |
93,310 |
55.6 |
11.8 |
12.4 |
15.2 |
4.2 |
0.6 |
0.2 |
60.4 |
39.4 |
19,585 |
| Uppsala |
S |
2.2 |
64,347 |
42.8 |
14.8 |
17.3 |
15.1 |
9.0 |
0.5 |
0.5 |
52.3 |
47.2 |
3,283 |
| Värmland |
S |
4.4 |
127,848 |
47.7 |
11.8 |
12.7 |
14.2 |
8.5 |
3.9 |
1.2 |
60.1 |
38.7 |
27,425 |
| Västerbotten |
N |
3.0 |
86,829 |
38.9 |
19.3 |
9.8 |
28.6 |
0.8 |
1.8 |
0.8 |
41.5 |
57.6 |
13,972 |
| Västernorrland |
N |
4.3 |
126,644 |
54.0 |
12.5 |
13.2 |
9.0 |
4.6 |
5.8 |
0.9 |
64.4 |
34.7 |
37,710 |
| Västmanland |
S |
2.7 |
77,979 |
54.2 |
10.4 |
15.7 |
13.1 |
4.3 |
2.3 |
0.0 |
60.7 |
39.3 |
16,753 |
| Älvsborg N |
G |
2.7 |
77,823 |
41.7 |
17.7 |
22.4 |
14.0 |
1.8 |
1.5 |
0.9 |
45.0 |
54.1 |
7,070 |
| Älvsborg S |
G |
2.3 |
67,827 |
37.8 |
29.9 |
18.8 |
9.0 |
1.5 |
1.0 |
2.0 |
40.4 |
57.7 |
11,741 |
| Örebro |
S |
3.6 |
103,986 |
52.7 |
12.7 |
11.4 |
15.6 |
5.7 |
1.3 |
0.6 |
59.6 |
39.8 |
20,626 |
| Östergötland |
G |
5.2 |
150,298 |
53.8 |
19.0 |
13.1 |
8.6 |
1.9 |
2.1 |
1.5 |
57.7 |
40.8 |
25,475 |
|
| Total |
|
100.0 |
2,917,753 |
45.9 |
17.6 |
14.4 |
12.9 |
4.4 |
3.3 |
1.6 |
53.6 |
44.8 |
254,689 |
| Source: SCB [1] |
| Location |
Land |
Share |
Votes |
S |
AV |
B |
FP |
SP |
K |
Other |
|
|
Margin |
|---|
|
|
|
|
|
|
|
|
|
|
|
|
|
|
% |
|
|
|
|
|
|
|
|
|
|
|
| Blekinge |
G |
2.1 |
60,941 |
28,422 |
13,129 |
7,896 |
7,466 |
1,030 |
1,848 |
1,150 |
31,300 |
28,491 |
2,809 |
| Bohuslän |
G |
3.1 |
90,989 |
38,169 |
20,988 |
15,400 |
10,223 |
1,382 |
3,157 |
1,670 |
42,708 |
46,611 |
3,903 |
| Gothenburg |
G |
4.3 |
126,844 |
54,881 |
30,746 |
|
13,054 |
7,094 |
15,946 |
5,123 |
77,921 |
43,800 |
34,121 |
| Gotland |
G |
1.0 |
28,222 |
9,249 |
3,900 |
10,698 |
3,683 |
89 |
116 |
487 |
9,454 |
18,281 |
8,827 |
| Gävleborg |
N |
4.1 |
118,894 |
58,673 |
11,599 |
15,990 |
13,578 |
12,160 |
6,188 |
706 |
77,021 |
41,167 |
35,854 |
| Halland |
G |
2.4 |
71,321 |
25,890 |
14,454 |
24,553 |
2,535 |
804 |
1,575 |
1,510 |
28,269 |
41,542 |
13,273 |
| Jämtland |
N |
1.9 |
56,077 |
28,053 |
10,181 |
7,392 |
8,353 |
431 |
1,410 |
257 |
29,894 |
25,926 |
3,968 |
| Jönköping |
G |
3.9 |
115,178 |
43,097 |
14,484 |
24,029 |
28,852 |
1,854 |
2,157 |
705 |
47,108 |
67,365 |
20,257 |
| Kalmar |
G |
3.6 |
104,044 |
43,326 |
21,763 |
27,102 |
6,901 |
379 |
3,086 |
1,487 |
46,791 |
55,766 |
8,975 |
| Kopparberg |
S |
3.8 |
110,643 |
52,418 |
9,550 |
14,439 |
18,851 |
13,404 |
1,531 |
450 |
67,353 |
42,840 |
24,513 |
| Kristianstad |
G |
3.7 |
109,063 |
46,567 |
16,962 |
25,753 |
16,215 |
322 |
1,357 |
1,887 |
48,246 |
58,930 |
10,684 |
| Kronoberg |
G |
2.4 |
70,426 |
25,740 |
14,979 |
19,300 |
5,853 |
1,238 |
2,548 |
768 |
29,526 |
40,132 |
10,606 |
| Malmö area |
G |
4.5 |
130,644 |
81,648 |
29,093 |
2,255 |
8,754 |
1,096 |
1,549 |
6,249 |
84,293 |
40,102 |
44,191 |
| Malmöhus |
G |
4.6 |
135,506 |
69,298 |
15,342 |
34,203 |
13,113 |
1,409 |
557 |
1,584 |
71,264 |
62,658 |
8,606 |
| Norrbotten |
N |
2.5 |
74,072 |
29,797 |
11,034 |
6,761 |
4,771 |
545 |
16,410 |
4,754 |
46,752 |
22,566 |
24,186 |
| Skaraborg |
G |
3.9 |
112,539 |
38,991 |
23,264 |
29,610 |
16,208 |
1,360 |
1,942 |
1,164 |
42,293 |
69,082 |
26,789 |
| Stockholm |
S |
10.1 |
296,091 |
124,754 |
76,058 |
2,894 |
45,934 |
29,781 |
9,517 |
7,153 |
164,052 |
124,886 |
39,166 |
| Stockholm County |
S |
4.4 |
129,368 |
60,537 |
23,235 |
12,408 |
17,013 |
11,924 |
2,710 |
1,541 |
75,171 |
52,656 |
22,515 |
| Södermanland |
S |
3.2 |
93,310 |
51,916 |
11,030 |
11,541 |
14,221 |
3,910 |
551 |
141 |
56,377 |
36,792 |
19,585 |
| Uppsala |
S |
2.2 |
64,347 |
27,545 |
9,499 |
11,144 |
9,729 |
5,763 |
347 |
320 |
33,655 |
30,372 |
3,283 |
| Värmland |
S |
4.4 |
127,848 |
60,995 |
15,015 |
16,235 |
18,189 |
10,904 |
4,965 |
1,545 |
76,864 |
49,439 |
27,425 |
| Västerbotten |
N |
3.0 |
86,829 |
33,812 |
16,735 |
8,493 |
24,806 |
651 |
1,599 |
733 |
36,062 |
50,034 |
13,972 |
| Västernorrland |
N |
4.3 |
126,644 |
68,403 |
15,773 |
16,700 |
11,436 |
5,821 |
7,395 |
1,116 |
81,619 |
43,909 |
37,710 |
| Västmanland |
S |
2.7 |
77,979 |
42,257 |
8,090 |
12,253 |
10,270 |
3,338 |
1,771 |
|
47,366 |
30,613 |
16,753 |
| Älvsborg N |
G |
2.7 |
77,823 |
32,465 |
13,785 |
17,425 |
10,867 |
1,381 |
1,161 |
739 |
35,007 |
42,077 |
7,070 |
| Älvsborg S |
G |
2.3 |
67,827 |
25,625 |
20,268 |
12,746 |
6,098 |
1,048 |
698 |
1,344 |
27,371 |
39,112 |
11,741 |
| Örebro |
S |
3.6 |
103,986 |
54,792 |
13,246 |
11,851 |
16,260 |
5,863 |
1,328 |
646 |
61,983 |
41,357 |
20,626 |
| Östergötland |
G |
5.2 |
150,298 |
80,800 |
28,579 |
19,769 |
12,928 |
2,851 |
3,100 |
2,271 |
86,751 |
61,276 |
25,475 |
|
| Total |
|
100.0 |
2,917,753 |
1,338,120 |
512,781 |
418,840 |
376,161 |
127,832 |
96,519 |
47,500 |
1,562,471 |
1,307,782 |
254,689 |
| Source: SCB [1] |
| Location |
Share |
Votes |
S |
AV |
B |
FP |
SP |
K |
Left |
Right |
|---|
| Bräkne |
14.7 |
8,965 |
52.2 |
17.1 |
19.2 |
6.3 |
0.7 |
3.8 |
56.7 |
42.7 |
| Karlshamn |
6.7 |
4,088 |
46.6 |
30.1 |
1.8 |
12.9 |
0.3 |
3.8 |
50.8 |
48.6 |
| Karlskrona |
18.4 |
11,228 |
46.7 |
30.1 |
0.5 |
14.7 |
1.5 |
2.3 |
50.4 |
45.3 |
| Lister |
17.4 |
10,617 |
43.9 |
22.3 |
15.3 |
13.9 |
0.5 |
3.4 |
47.7 |
51.6 |
| Medelstad |
20.3 |
12,357 |
47.7 |
14.6 |
20.7 |
8.6 |
3.3 |
3.1 |
54.0 |
43.9 |
| Ronneby |
4.5 |
2,768 |
49.1 |
27.1 |
1.5 |
13.3 |
2.9 |
4.9 |
56.9 |
41.9 |
| Sölvesborg |
3.2 |
1,929 |
44.5 |
26.4 |
1.3 |
18.8 |
6.6 |
0.7 |
51.8 |
46.5 |
| Östra |
13.7 |
8,371 |
42.5 |
14.6 |
21.3 |
16.1 |
1.4 |
2.2 |
46.1 |
52.0 |
| Postal vote |
1.0 |
618 |
|
|
|
|
|
|
|
|
| Total |
2.1 |
60,941 |
46.6 |
21.5 |
13.0 |
12.3 |
1.7 |
3.0 |
51.4 |
46.8 |
| Source: SCB [1] |
| Location |
Share |
Votes |
S |
AV |
B |
FP |
SP |
K |
Left |
Right |
|---|
| Askim |
9.7 |
8,822 |
39.9 |
27.5 |
10.5 |
12.5 |
2.5 |
4.4 |
46.8 |
50.5 |
| Bullaren |
1.1 |
1,036 |
17.1 |
20.4 |
51.4 |
9.5 |
0.7 |
0.5 |
18.2 |
81.2 |
| Inlands Fräkne |
2.2 |
2,001 |
28.8 |
29.4 |
25.8 |
13.4 |
0.0 |
0.2 |
29.0 |
68.7 |
| Inlands Nordre |
4.6 |
4,174 |
24.1 |
36.2 |
28.7 |
7.6 |
0.2 |
0.4 |
24.7 |
72.5 |
| Inlands Södre |
3.4 |
3,096 |
22.0 |
32.7 |
35.8 |
4.7 |
0.0 |
1.2 |
23.2 |
73.3 |
| Inlands Torpe |
2.2 |
2,010 |
55.2 |
11.8 |
27.9 |
2.7 |
0.0 |
2.2 |
57.4 |
42.4 |
| Kungälv |
1.6 |
1,452 |
56.8 |
28.7 |
2.5 |
9.4 |
0.1 |
1.9 |
58.8 |
40.6 |
| Kville |
2.8 |
2,532 |
31.1 |
12.8 |
33.7 |
19.3 |
0.6 |
2.2 |
34.0 |
65.8 |
| Lane |
3.3 |
3,046 |
29.8 |
20.5 |
31.4 |
17.1 |
0.1 |
0.3 |
30.2 |
68.9 |
| Lysekil |
3.1 |
2,817 |
54.6 |
28.9 |
0.1 |
7.3 |
0.2 |
7.6 |
62.5 |
36.3 |
| Marstrand |
0.6 |
515 |
37.5 |
36.3 |
0.0 |
17.3 |
0.2 |
7.6 |
45.0 |
53.6 |
| Mölndal |
8.3 |
7,568 |
55.0 |
9.8 |
2.3 |
6.4 |
5.9 |
16.4 |
77.4 |
18.6 |
| Orust Västra |
4.4 |
4,042 |
27.0 |
39.0 |
16.1 |
17.2 |
0.0 |
0.0 |
27.0 |
72.4 |
| Orust Östra |
2.0 |
1,824 |
28.5 |
24.4 |
29.9 |
16.3 |
0.0 |
0.2 |
28.7 |
70.7 |
| Sotenäs |
6.5 |
5,876 |
51.7 |
15.8 |
13.6 |
11.0 |
6.5 |
0.7 |
59.0 |
40.4 |
| Strömstad |
1.5 |
1,405 |
51.7 |
38.0 |
1.6 |
4.7 |
0.3 |
2.1 |
54.2 |
44.3 |
| Stångenäs |
4.4 |
3,978 |
59.6 |
25.7 |
5.9 |
6.6 |
0.1 |
1.0 |
60.6 |
38.2 |
| Sävedal |
5.5 |
5,048 |
47.1 |
14.7 |
12.7 |
10.0 |
2.6 |
9.3 |
59.0 |
37.4 |
| Sörbygden |
1.6 |
1,487 |
12.0 |
42.2 |
41.5 |
3.5 |
0.1 |
0.2 |
12.2 |
87.2 |
| Tanum |
3.3 |
3,017 |
28.3 |
30.3 |
28.9 |
10.6 |
0.1 |
0.5 |
28.9 |
69.9 |
| Tjörn |
3.1 |
2,776 |
10.2 |
26.8 |
26.5 |
34.9 |
0.0 |
0.3 |
10.6 |
88.2 |
| Tunge |
4.1 |
3,760 |
52.7 |
16.2 |
16.6 |
10.6 |
0.1 |
1.9 |
54.7 |
43.4 |
| Uddevalla |
8.5 |
7,693 |
59.0 |
20.2 |
0.6 |
16.8 |
0.8 |
0.9 |
60.7 |
37.7 |
| Vette |
5.0 |
4,529 |
55.8 |
9.0 |
29.4 |
3.5 |
0.4 |
0.6 |
56.8 |
41.9 |
| Västra Hising |
6.4 |
5,843 |
33.4 |
29.5 |
20.2 |
10.3 |
0.2 |
4.9 |
38.6 |
60.0 |
| Östra Hising |
0.5 |
484 |
30.6 |
9.9 |
45.2 |
5.4 |
1.4 |
3.7 |
35.7 |
60.5 |
| Postal vote |
0.2 |
158 |
|
|
|
|
|
|
|
|
| Total |
3.1 |
90,989 |
41.9 |
23.1 |
16.9 |
11.2 |
1.5 |
3.5 |
46.9 |
51.2 |
| Source: SCB [1] |
| Location |
Share |
Votes |
S |
AV |
FP |
SP |
K |
Left |
Right |
|---|
| Gothenburg |
100.0 |
126,844 |
43.3 |
24.2 |
10.3 |
5.6 |
12.6 |
61.4 |
34.5 |
| Total |
4.3 |
126,844 |
43.3 |
24.2 |
10.3 |
5.6 |
12.6 |
61.4 |
34.5 |
| Source: SCB [1] |
| Location |
Share |
Votes |
S |
AV |
B |
FP |
SP |
K |
Left |
Right |
|---|
| Gotland Norra |
40.6 |
11,454 |
34.6 |
8.8 |
45.4 |
7.8 |
0.5 |
0.6 |
35.8 |
62.0 |
| Gotland Södra |
39.9 |
11,260 |
21.1 |
9.8 |
47.5 |
20.4 |
0.1 |
0.1 |
21.3 |
77.7 |
| Visby |
19.3 |
5,457 |
52.8 |
32.5 |
2.9 |
9.0 |
0.3 |
0.4 |
53.6 |
44.4 |
| Postal vote |
0.2 |
51 |
|
|
|
|
|
|
|
|
| Total |
1.0 |
28,222 |
32.8 |
13.8 |
37.9 |
13.1 |
0.3 |
0.4 |
33.5 |
64.8 |
| Source: SCB [1] |
| Location |
Share |
Votes |
S |
AV |
B |
FP |
SP |
K |
Left |
Right |
|---|
| Ala |
10.1 |
12,044 |
58.2 |
4.6 |
15.1 |
6.0 |
5.1 |
10.6 |
73.9 |
25.6 |
| Bergsjö-Forsa |
9.1 |
10,849 |
36.6 |
5.0 |
31.6 |
11.5 |
8.6 |
6.5 |
51.6 |
48.1 |
| Bollnäs |
12.7 |
15,108 |
46.8 |
6.5 |
18.1 |
14.5 |
6.0 |
7.8 |
60.6 |
39.1 |
| Delsbo |
3.4 |
3,999 |
37.0 |
8.5 |
42.4 |
5.4 |
5.2 |
1.1 |
43.2 |
56.2 |
| Enånger |
2.8 |
3,326 |
38.9 |
4.9 |
18.0 |
8.3 |
18.6 |
10.9 |
68.5 |
31.2 |
| Gästrikland Västra |
11.5 |
13,681 |
48.1 |
9.0 |
14.1 |
9.3 |
16.7 |
2.5 |
67.3 |
32.4 |
| Gästrikland Östra |
16.3 |
19,352 |
58.0 |
7.3 |
7.0 |
11.5 |
14.0 |
1.9 |
73.9 |
25.9 |
| Gävle |
15.1 |
17,988 |
57.7 |
17.9 |
0.1 |
16.5 |
5.7 |
0.7 |
64.1 |
34.5 |
| Hudiksvall |
2.8 |
3,294 |
29.9 |
24.5 |
2.7 |
17.1 |
15.8 |
9.2 |
54.9 |
44.3 |
| Söderhamn |
4.5 |
5,314 |
54.0 |
19.1 |
0.4 |
9.3 |
5.9 |
10.2 |
70.1 |
28.7 |
| Västra Hälsingland |
11.6 |
13,834 |
41.8 |
9.3 |
16.7 |
10.1 |
14.6 |
6.7 |
63.2 |
36.1 |
| Postal vote |
0.1 |
105 |
|
|
|
|
|
|
|
|
| Total |
4.1 |
118,894 |
49.4 |
9.8 |
13.4 |
11.4 |
10.2 |
5.2 |
64.8 |
34.6 |
| Source: SCB [1] |
| Location |
Share |
Votes |
S |
AV |
B |
FP |
SP |
K |
Left |
Right |
|---|
| Falkenberg |
3.8 |
2,699 |
47.4 |
31.7 |
4.9 |
7.3 |
5.7 |
1.6 |
54.7 |
43.9 |
| Faurås |
10.2 |
7,275 |
21.8 |
18.0 |
56.1 |
2.0 |
0.9 |
0.5 |
23.2 |
76.1 |
| Fjäre |
11.3 |
8,057 |
24.9 |
21.2 |
48.4 |
1.7 |
1.4 |
0.1 |
26.5 |
71.3 |
| Halmstad |
17.2 |
12,273 |
56.1 |
24.9 |
3.1 |
5.4 |
1.3 |
7.1 |
64.4 |
33.3 |
| Halmstad Hundred |
10.6 |
7,571 |
46.5 |
17.4 |
30.6 |
2.8 |
0.1 |
1.5 |
48.1 |
50.7 |
| Himle |
7.4 |
5,250 |
18.1 |
19.0 |
54.1 |
4.2 |
0.7 |
1.6 |
20.4 |
77.3 |
| Hök |
12.0 |
8,548 |
26.2 |
7.4 |
61.3 |
2.4 |
0.0 |
0.5 |
26.7 |
71.1 |
| Kungsbacka |
1.6 |
1,149 |
33.5 |
42.7 |
5.8 |
6.3 |
4.0 |
0.8 |
38.3 |
54.8 |
| Laholm |
1.8 |
1,280 |
43.1 |
25.4 |
19.4 |
3.4 |
0.2 |
0.3 |
43.7 |
48.2 |
| Tönnersjö |
7.2 |
5,163 |
44.0 |
14.4 |
35.4 |
2.3 |
0.2 |
3.4 |
47.6 |
52.1 |
| Varberg |
6.6 |
4,681 |
50.6 |
26.7 |
2.8 |
8.2 |
3.3 |
3.5 |
57.4 |
37.7 |
| Viske |
3.5 |
2,483 |
18.6 |
20.9 |
55.8 |
3.5 |
0.0 |
0.2 |
18.8 |
80.1 |
| Årstad |
6.8 |
4,855 |
28.3 |
25.5 |
41.4 |
1.1 |
1.1 |
0.2 |
29.6 |
68.1 |
| Postal vote |
0.1 |
37 |
|
|
|
|
|
|
|
|
| Total |
2.4 |
71,321 |
36.3 |
20.3 |
34.4 |
3.6 |
1.1 |
2.2 |
39.6 |
58.2 |
| Source: SCB [1] |
| Location |
Share |
Votes |
S |
AV |
B |
FP |
SP |
K |
Left |
Right |
|---|
| Berg |
4.7 |
2,616 |
49.1 |
17.3 |
12.6 |
17.3 |
0.9 |
1.4 |
51.4 |
47.2 |
| Hammerdal |
12.1 |
6,775 |
52.3 |
18.2 |
14.7 |
12.0 |
0.5 |
1.9 |
54.7 |
44.9 |
| Hede |
3.1 |
1,754 |
55.2 |
11.1 |
6.4 |
22.5 |
1.4 |
3.0 |
59.6 |
40.0 |
| Lits-Rödön |
14.7 |
8,244 |
44.5 |
14.6 |
19.8 |
17.6 |
1.1 |
2.2 |
47.9 |
52.0 |
| Ragunda |
12.2 |
6,863 |
64.8 |
14.7 |
11.9 |
6.7 |
0.6 |
0.9 |
66.4 |
33.3 |
| Revsund-Brunflo-Näs |
13.9 |
7,811 |
52.5 |
14.5 |
18.4 |
11.4 |
0.6 |
2.4 |
55.5 |
44.3 |
| Sunne-Oviken-Hallen |
8.3 |
4,672 |
38.9 |
18.7 |
20.5 |
19.5 |
0.4 |
1.5 |
40.8 |
58.7 |
| Sveg |
6.1 |
3,398 |
62.3 |
10.5 |
6.2 |
10.9 |
0.5 |
9.4 |
72.2 |
27.7 |
| Undersåker-Offerdal |
12.8 |
7,182 |
45.3 |
17.5 |
9.9 |
23.9 |
0.8 |
2.6 |
48.6 |
51.2 |
| Östersund |
12.0 |
6,728 |
42.1 |
36.6 |
2.8 |
13.3 |
1.1 |
2.7 |
45.9 |
52.6 |
| Postal vote |
0.1 |
34 |
|
|
|
|
|
|
|
|
| Total |
1.9 |
56,077 |
50.0 |
18.1 |
13.2 |
14.9 |
0.8 |
2.5 |
53.3 |
46.2 |
| Source: SCB [1] |
| Location |
Share |
Votes |
S |
AV |
B |
FP |
SP |
K |
Left |
Right |
|---|
| Eksjö |
3.0 |
3,505 |
42.7 |
27.4 |
1.6 |
23.3 |
0.8 |
0.5 |
44.0 |
52.3 |
| Gränna |
0.6 |
704 |
32.4 |
30.7 |
1.1 |
31.1 |
0.3 |
4.4 |
37.1 |
62.9 |
| Huskvarna |
3.9 |
4,530 |
60.9 |
7.3 |
0.4 |
23.0 |
0.4 |
7.7 |
69.1 |
30.7 |
| Jönköping |
14.3 |
16,492 |
50.7 |
19.2 |
0.7 |
25.8 |
0.6 |
1.8 |
53.1 |
45.7 |
| Mo |
2.8 |
3,188 |
15.8 |
6.1 |
29.5 |
48.1 |
0.1 |
0.0 |
15.9 |
83.7 |
| Norra Vedbo |
5.9 |
6,785 |
26.8 |
16.3 |
22.7 |
30.8 |
1.6 |
1.1 |
29.5 |
69.8 |
| Nässjö |
4.0 |
4,633 |
56.1 |
16.3 |
1.4 |
20.0 |
3.1 |
1.7 |
60.9 |
37.6 |
| Södra Vedbo |
6.2 |
7,183 |
33.9 |
9.7 |
33.8 |
19.6 |
1.3 |
0.9 |
36.1 |
63.1 |
| Tranås |
3.0 |
3,403 |
49.7 |
15.4 |
0.9 |
26.7 |
4.7 |
1.6 |
55.9 |
43.0 |
| Tveta |
9.2 |
10,617 |
43.7 |
7.0 |
18.0 |
28.9 |
0.5 |
1.6 |
45.8 |
53.9 |
| Vetlanda |
1.7 |
1,979 |
44.7 |
24.1 |
1.2 |
23.5 |
0.1 |
4.9 |
49.7 |
48.8 |
| Vista |
2.7 |
3,159 |
21.9 |
8.0 |
29.6 |
39.2 |
0.2 |
1.0 |
23.1 |
76.8 |
| Värnamo |
2.1 |
2,373 |
49.4 |
20.6 |
1.6 |
21.0 |
1.2 |
6.0 |
56.6 |
43.2 |
| Västbo |
13.6 |
15,690 |
33.1 |
10.6 |
38.2 |
13.2 |
3.5 |
1.2 |
37.9 |
62.0 |
| Västra |
10.5 |
12,150 |
24.9 |
8.0 |
37.4 |
26.0 |
1.9 |
1.7 |
28.5 |
71.4 |
| Östbo |
8.3 |
9,539 |
28.0 |
12.3 |
24.7 |
31.3 |
1.7 |
1.9 |
31.6 |
68.2 |
| Östra |
8.0 |
9,205 |
31.5 |
8.2 |
32.9 |
23.4 |
1.7 |
1.9 |
35.1 |
64.5 |
| Postal vote |
0.0 |
43 |
|
|
|
|
|
|
|
|
| Total |
3.9 |
115,178 |
37.4 |
12.6 |
20.9 |
25.0 |
1.6 |
1.9 |
40.9 |
58.5 |
| Source: SCB [1] |
| Location |
Share |
Votes |
S |
AV |
B |
FP |
SP |
K |
Left |
Right |
|---|
| Algutsrum |
2.6 |
2,729 |
35.8 |
28.1 |
30.8 |
2.2 |
0.0 |
0.1 |
35.9 |
61.1 |
| Aspeland |
6.6 |
6,880 |
44.3 |
14.8 |
28.0 |
11.4 |
0.1 |
1.3 |
45.7 |
54.2 |
| Borgholm |
1.0 |
1,008 |
46.4 |
31.9 |
4.2 |
17.2 |
0.0 |
0.0 |
46.4 |
53.3 |
| Gräsgård |
1.9 |
2,027 |
48.0 |
20.8 |
25.0 |
2.7 |
0.0 |
0.8 |
48.8 |
48.4 |
| Handbörd |
6.1 |
6,396 |
40.2 |
16.7 |
28.3 |
6.0 |
0.0 |
6.1 |
46.3 |
51.2 |
| Kalmar |
9.5 |
9,877 |
54.2 |
30.4 |
1.6 |
6.5 |
0.0 |
4.7 |
59.0 |
38.5 |
| Möckleby |
1.3 |
1,304 |
13.0 |
30.0 |
48.5 |
1.5 |
0.0 |
0.0 |
13.0 |
80.0 |
| Norra Möre |
4.9 |
5,062 |
42.8 |
22.7 |
28.4 |
3.1 |
0.0 |
0.8 |
43.5 |
54.2 |
| Norra Tjust |
7.3 |
7,617 |
45.9 |
17.7 |
30.2 |
4.2 |
0.1 |
0.8 |
46.9 |
52.2 |
| Nybro |
2.2 |
2,249 |
54.1 |
24.6 |
1.5 |
9.3 |
0.2 |
9.5 |
63.8 |
35.3 |
| Oskarshamn |
4.1 |
4,280 |
65.3 |
22.4 |
0.6 |
9.5 |
0.0 |
1.6 |
66.9 |
32.5 |
| Runsten |
1.7 |
1,808 |
10.8 |
13.2 |
69.2 |
1.9 |
0.0 |
0.0 |
10.8 |
84.3 |
| Sevede |
6.9 |
7,185 |
30.6 |
19.0 |
41.3 |
8.1 |
0.3 |
0.4 |
31.3 |
68.4 |
| Slättbo |
1,3 |
1,336 |
24.3 |
13.7 |
58.2 |
2.8 |
0.0 |
0.0 |
24.3 |
74.7 |
| Stranda |
6.1 |
6,331 |
45.4 |
18.8 |
20.4 |
6.4 |
0.0 |
8.1 |
53.7 |
45.6 |
| Södra Möre |
14.6 |
15,154 |
36.1 |
21.4 |
34.7 |
4.4 |
0.3 |
1.4 |
37.8 |
60.5 |
| Södra Tjust |
8.4 |
8,765 |
44.4 |
16.3 |
27.8 |
4.8 |
0.8 |
5.6 |
50.8 |
48.9 |
| Tunalän |
4.5 |
4,672 |
34.9 |
20.7 |
32.4 |
8.4 |
0.0 |
3.0 |
37.9 |
61.5 |
| Vimmerby |
1.6 |
1,672 |
39.1 |
35.1 |
5.9 |
16.9 |
0.4 |
1.9 |
41.3 |
57.8 |
| Västervik |
4.6 |
4,834 |
44.2 |
29.3 |
1.2 |
13.7 |
4.3 |
5.8 |
54.3 |
44.3 |
| Åkerbo |
2.6 |
2,746 |
24.1 |
4.7 |
63.3 |
7.3 |
0.0 |
0.4 |
24.5 |
75.2 |
| Postal vote |
0.1 |
112 |
|
|
|
|
|
|
|
|
| Total |
3.6 |
104,044 |
41.6 |
20.9 |
26.0 |
6.6 |
0.4 |
3.0 |
45.0 |
53.6 |
| Source: SCB [1] |
| Location |
Share |
Votes |
S |
AV |
B |
FP |
SP |
K |
Left |
Right |
|---|
| Avesta |
2.6 |
2,833 |
55.5 |
7.1 |
0.5 |
12.6 |
24.0 |
0.3 |
79.7 |
20.2 |
| Falu Norra |
8.1 |
8,954 |
43.3 |
6.0 |
12.4 |
22.2 |
15.0 |
0.8 |
59.1 |
40.6 |
| Falu Södra |
13.4 |
14,853 |
51.5 |
5.9 |
14.2 |
12.4 |
14.5 |
1.3 |
67.4 |
32.5 |
| Falun |
5.7 |
6,292 |
43.7 |
26.2 |
0.6 |
24.0 |
4.1 |
1.0 |
48.8 |
50.7 |
| Folkare |
6.4 |
7,126 |
45.0 |
6.9 |
20.5 |
13.0 |
11.8 |
2.7 |
59.5 |
40.4 |
| Hedemora |
1.8 |
1,970 |
43.6 |
20.5 |
4.3 |
27.2 |
3.4 |
1.0 |
47.9 |
51.9 |
| Hedemora ting |
7.9 |
8,753 |
47.6 |
4.6 |
30.7 |
9.7 |
6.1 |
1.1 |
54.9 |
45.1 |
| Leksand-Gagnef |
9.5 |
10,507 |
41.5 |
7.6 |
19.3 |
25.2 |
5.9 |
0.2 |
47.6 |
52.2 |
| Ludvika |
2.7 |
2,947 |
56.1 |
18.4 |
0.3 |
12.2 |
11.6 |
1.1 |
68.8 |
31.0 |
| Malung |
5.8 |
6,387 |
57.1 |
8.0 |
6.0 |
22.0 |
5.3 |
1.2 |
63.7 |
36.1 |
| Mora |
6.2 |
6,907 |
40.7 |
7.3 |
17.1 |
22.9 |
8.9 |
2.0 |
51.7 |
47.3 |
| Nås |
6.4 |
7,125 |
46.3 |
8.6 |
12.4 |
11.9 |
18.5 |
1.1 |
65.9 |
32.9 |
| Orsa |
3.1 |
3,390 |
45.8 |
11.5 |
15.5 |
15.1 |
10.4 |
1.2 |
57.3 |
42.1 |
| Rättvik |
4.4 |
4,866 |
35.8 |
9.7 |
12.5 |
26.9 |
11.2 |
3.8 |
50.8 |
49.1 |
| Särna-Idre |
0.9 |
1,021 |
55.7 |
4.9 |
3.4 |
24.9 |
10.4 |
0.0 |
66.1 |
33.2 |
| Säter |
1.0 |
1,076 |
54.8 |
16.0 |
2.0 |
19.1 |
8.1 |
0.0 |
62.9 |
37.1 |
| Västerbergslag |
12.0 |
13,257 |
55.3 |
6.0 |
6.7 |
10.2 |
19.5 |
2.1 |
76.9 |
22.8 |
| Älvdalen |
2.1 |
2,347 |
33.0 |
5.5 |
16.2 |
15.3 |
25.5 |
1.0 |
59.4 |
36.9 |
| Postal vote |
0.0 |
32 |
|
|
|
|
|
|
|
|
| Total |
3.8 |
110,643 |
47.4 |
8.6 |
13.1 |
17.0 |
12.1 |
1.4 |
60.9 |
38.7 |
| Source: SCB [1] |
| Location |
Share |
Votes |
S |
AV |
B |
FP |
SP |
K |
Left |
Right |
|---|
| Albo |
3.7 |
4,078 |
29.6 |
13.8 |
22.6 |
29.6 |
1.7 |
1.3 |
32.6 |
66.0 |
| Bjäre |
6.1 |
6,636 |
34.6 |
17.3 |
39.3 |
6.1 |
0.2 |
0.0 |
34.7 |
62.6 |
| Gärd |
9.3 |
10,154 |
47.7 |
10.3 |
18.2 |
22.0 |
0.1 |
1.1 |
48.9 |
50.5 |
| Hässleholm |
1.6 |
1,733 |
50.0 |
29.5 |
2.2 |
14.5 |
0.2 |
1.0 |
51.2 |
46.2 |
| Ingelstad |
10.7 |
11,707 |
38.5 |
11.0 |
23.6 |
25.2 |
0.3 |
0.0 |
38.9 |
59.8 |
| Järrestad |
3.8 |
4,145 |
44.4 |
11.2 |
23.2 |
19.9 |
0.1 |
0.6 |
45.0 |
54.3 |
| Kristianstad |
6.3 |
6,860 |
45.2 |
31.9 |
2.4 |
17.0 |
0.0 |
1.1 |
46.3 |
51.2 |
| Norra Åsbo |
12.0 |
13,035 |
40.8 |
17.6 |
32.3 |
7.1 |
0.6 |
0.3 |
41.7 |
56.9 |
| Simrishamn |
1.2 |
1,327 |
50.0 |
35.4 |
0.5 |
11.8 |
0.0 |
1.3 |
51.2 |
47.8 |
| Södra Åsbo |
6.6 |
7,201 |
51.4 |
10.2 |
31.0 |
4.3 |
0.1 |
0.6 |
52.1 |
45.5 |
| Villand |
9.6 |
10,455 |
52.7 |
11.5 |
18.6 |
12.9 |
0.3 |
3.1 |
56.1 |
42.9 |
| Västra Göinge |
14.5 |
15,862 |
33.6 |
16.0 |
32.2 |
15.9 |
0.0 |
0.7 |
34.3 |
64.1 |
| Ängelholm |
2.7 |
2,942 |
57.6 |
26.6 |
4.4 |
2.7 |
0.0 |
0.0 |
57.6 |
33.7 |
| Östra Göinge |
11.7 |
12,811 |
44.1 |
13.2 |
22.0 |
14.3 |
0.6 |
4.0 |
48.7 |
49.5 |
| Postal vote |
0.1 |
117 |
|
|
|
|
|
|
|
|
| Total |
3.7 |
109,063 |
42.7 |
15.5 |
23.6 |
14.9 |
0.3 |
1.2 |
44.2 |
54.0 |
| Source: SCB [1] |
| Location |
Share |
Votes |
S |
AV |
B |
FP |
SP |
K |
Left |
Right |
|---|
| Allbo |
18.3 |
12,910 |
37.6 |
24.2 |
27.9 |
6.9 |
0.9 |
1.4 |
39.9 |
59.1 |
| Kinnevald |
9.7 |
6,825 |
31.4 |
31.3 |
25.8 |
5.7 |
1.7 |
3.0 |
36.1 |
62.8 |
| Konga |
19.6 |
13,816 |
39.5 |
19.5 |
26.4 |
6.6 |
2.4 |
4.7 |
46.6 |
52.5 |
| Ljungby |
3.2 |
2,274 |
42.1 |
25.3 |
6.6 |
19.2 |
1.3 |
4.5 |
47.9 |
51.2 |
| Norrvidinge |
5.3 |
3,708 |
33.7 |
21.0 |
38.8 |
4.6 |
0.6 |
0.9 |
35.2 |
64.4 |
| Sunnerbo |
21.0 |
14,788 |
26.5 |
18.6 |
39.1 |
11.6 |
1.1 |
1.7 |
29.3 |
69.3 |
| Uppvidinge |
16.5 |
11,633 |
46.0 |
12.7 |
24.4 |
5.6 |
3.4 |
7.3 |
56.8 |
42.7 |
| Växjö |
6.3 |
4,445 |
40.2 |
31.9 |
1.8 |
15.5 |
1.6 |
5.8 |
47.6 |
49.2 |
| Postal vote |
0.0 |
27 |
|
|
|
|
|
|
|
|
| Total |
2.4 |
70,426 |
36.5 |
21.3 |
27.4 |
8.3 |
1.8 |
3.6 |
41.9 |
57.0 |
| Source: SCB [1] |
| Location |
Share |
Votes |
S |
AV |
B |
FP |
SP |
K |
Left |
Right |
|---|
| Hälsingborg |
23.0 |
30,060 |
59.2 |
24.3 |
1.6 |
4.3 |
2.1 |
0.6 |
61.9 |
30.2 |
| Landskrona |
8.0 |
10,450 |
69.9 |
16.0 |
0.6 |
9.0 |
0.8 |
1.7 |
72.4 |
25.6 |
| Lund |
11.1 |
14,437 |
54.1 |
26.3 |
2.1 |
9.3 |
0.1 |
0.9 |
55.1 |
37.8 |
| Malmö |
57.8 |
75,513 |
64.4 |
21.5 |
1.9 |
6.9 |
0.5 |
1.4 |
66.3 |
30.2 |
| Postal vote |
0.1 |
184 |
|
|
|
|
|
|
|
|
| Total |
4.5 |
130,644 |
62.5 |
22.3 |
1.7 |
6.7 |
0.8 |
1.2 |
64.5 |
30.7 |
| Source: SCB [1] |
| Location |
Share |
Votes |
S |
AV |
B |
FP |
SP |
K |
Left |
Right |
|---|
| Bara |
7.9 |
10,700 |
60.8 |
10.9 |
21.4 |
4.3 |
0.8 |
0.4 |
62.0 |
36.6 |
| Eslöv |
2.4 |
3,274 |
57.6 |
24.1 |
3.3 |
12.6 |
0.2 |
1.2 |
59.0 |
39.9 |
| Frosta |
8.8 |
11,871 |
32.5 |
11.2 |
27.7 |
26.5 |
1.4 |
0.1 |
34.0 |
65.4 |
| Färs |
8.0 |
10,841 |
34.0 |
7.5 |
29.2 |
27.1 |
0.9 |
0.1 |
35.0 |
63.7 |
| Harjager |
4.8 |
6,563 |
52.8 |
11.7 |
30.3 |
3.5 |
1.0 |
0.2 |
54.0 |
45.5 |
| Herrestad |
2.6 |
3,482 |
54.7 |
5.7 |
25.6 |
13.6 |
0.1 |
0.0 |
54.8 |
44.9 |
| Höganäs |
2.8 |
3,735 |
75.5 |
12.4 |
3.3 |
5.4 |
0.3 |
0.0 |
75.9 |
21.1 |
| Ljunit |
2.2 |
2,943 |
49.4 |
5.3 |
35.1 |
9.5 |
0.3 |
0.0 |
49.8 |
49.9 |
| Luggude |
14.2 |
19,191 |
53.3 |
11.0 |
27.1 |
4.2 |
0.4 |
0.9 |
54.6 |
42.3 |
| Onsjö |
5.7 |
7,698 |
47.2 |
12.9 |
23.2 |
3.6 |
0.5 |
0.3 |
48.1 |
51.6 |
| Oxie |
6.6 |
8,945 |
59.2 |
8.8 |
26.0 |
3.7 |
1.6 |
0.2 |
61.1 |
38.5 |
| Rönneberg |
4.2 |
5,704 |
59.0 |
12.9 |
23.2 |
3.6 |
0.2 |
0.2 |
59.3 |
39.7 |
| Skanör-Falsterbo |
0.4 |
482 |
24.3 |
45.9 |
13.3 |
12.0 |
0.0 |
0.0 |
24.3 |
71.2 |
| Skytt |
5.0 |
6,841 |
48.8 |
10.4 |
33.3 |
4.2 |
2.2 |
0.3 |
51.2 |
47.9 |
| Torna |
7.8 |
10,555 |
51.8 |
9.3 |
33.0 |
4.3 |
0.5 |
0.3 |
52.6 |
46.6 |
| Trälleborg |
4.8 |
6,452 |
59.4 |
19.2 |
2.4 |
11.3 |
4.9 |
2.2 |
66.5 |
33.0 |
| Vemmenhög |
7.5 |
10,226 |
46.9 |
8.0 |
35.1 |
9.0 |
0.7 |
0.1 |
47.8 |
52.1 |
| Ystad |
4.3 |
5,874 |
61.4 |
20.9 |
0.8 |
14.1 |
1.6 |
0.1 |
63.1 |
35.9 |
| Postal vote |
0.1 |
129 |
|
|
|
|
|
|
|
|
| Total |
4.6 |
135,506 |
51.1 |
11.3 |
25.3 |
9.7 |
1.0 |
0.4 |
52.6 |
46.2 |
| Source: SCB [1] |
| Location |
Share |
Votes |
S |
AV |
B |
FP |
SP |
K |
Left |
Right |
|---|
| Arjeplog |
1.2 |
903 |
32.2 |
20.7 |
1.8 |
11.2 |
0.0 |
34.9 |
67.1 |
31.5 |
| Arvidsjaur |
4.4 |
3,272 |
41.7 |
14.9 |
2.6 |
10.1 |
0.5 |
28.3 |
70.4 |
27.6 |
| Boden |
4.0 |
2,943 |
38.9 |
17.9 |
0.1 |
8.7 |
1.8 |
8.1 |
48.8 |
26.8 |
| Gällivare |
8.5 |
6,332 |
35.5 |
21.5 |
1.2 |
1.6 |
0.2 |
33.1 |
68.8 |
24.2 |
| Haparanda |
1.3 |
939 |
24.6 |
34.4 |
1.2 |
3.2 |
0.0 |
15.5 |
40.1 |
38.8 |
| Jokkmokk |
2.8 |
2,092 |
34.7 |
13.9 |
1.0 |
8.1 |
2.7 |
33.5 |
70.8 |
22.9 |
| Jukkasjärvi |
7.8 |
5,806 |
37.0 |
11.3 |
0.4 |
6.5 |
6.0 |
33.9 |
76.9 |
18.2 |
| Karesuando |
0.2 |
145 |
15.9 |
71.0 |
0.7 |
2.8 |
0.0 |
4.8 |
20.7 |
74.5 |
| Luleå |
8.2 |
6,067 |
37.8 |
19.2 |
0.4 |
6.5 |
0.0 |
23.1 |
61.0 |
26.1 |
| Nederkalix |
10.2 |
7,529 |
47.7 |
11.5 |
12.0 |
7.0 |
0.3 |
15.2 |
63.2 |
30.4 |
| Nederluleå |
5.8 |
4,264 |
23.9 |
22.6 |
22.0 |
15.7 |
0.0 |
10.2 |
34.1 |
60.2 |
| Pajala |
4.7 |
3,518 |
31.6 |
22.1 |
7.1 |
2.3 |
0.1 |
31.1 |
62.8 |
31.5 |
| Piteå |
1.9 |
1,375 |
50.8 |
28.7 |
1.3 |
4.4 |
0.0 |
5.5 |
56.3 |
34.5 |
| Piteå-Älvsby |
16.7 |
12,355 |
58.8 |
7.9 |
14.9 |
2.5 |
0.1 |
14.4 |
73.3 |
25.3 |
| Råneå |
4.9 |
3,635 |
35.5 |
9.8 |
10.6 |
8.8 |
0.0 |
26.1 |
61.6 |
29.2 |
| Torneå |
6.9 |
5,105 |
35.8 |
14.7 |
19.0 |
4.8 |
0.0 |
22.5 |
58.3 |
38.5 |
| Överkalix |
3.8 |
2,814 |
38.8 |
4.2 |
21.2 |
4.7 |
0.0 |
28.0 |
66.8 |
30.1 |
| Överluleå |
6.6 |
4,886 |
28.8 |
15.1 |
12.3 |
14.0 |
0.5 |
24.1 |
53.3 |
41.5 |
| Postal vote |
0.1 |
92 |
|
|
|
|
|
|
|
|
| Total |
2.5 |
74,072 |
40.2 |
14.9 |
9.1 |
6.5 |
0.7 |
22.2 |
63.1 |
30.5 |
| Source: SCB [1] |
| Location |
Share |
Votes |
S |
AV |
B |
FP |
SP |
K |
Left |
Right |
|---|
| Barne |
5.1 |
5,767 |
15.6 |
32.0 |
35.2 |
15.2 |
0.5 |
0.9 |
17.0 |
82.4 |
| Falköping |
3.8 |
4,254 |
49.4 |
27.8 |
2.1 |
17.8 |
0.9 |
1.2 |
51.5 |
47.6 |
| Frökind |
1.0 |
1,142 |
11.2 |
33.3 |
44.1 |
10.6 |
0.0 |
0.1 |
11.3 |
88.0 |
| Gudhem |
3.7 |
4,199 |
32.3 |
15.8 |
40.7 |
9.7 |
0.2 |
0.9 |
33.4 |
66.1 |
| Hjo |
1.4 |
1,607 |
38.4 |
32.7 |
3.1 |
23.5 |
0.7 |
0.4 |
39.5 |
59.2 |
| Kinne |
5.0 |
5,592 |
41.0 |
14.2 |
14.8 |
23.7 |
3.2 |
1.8 |
46.0 |
52.6 |
| Kinnefjärding |
2.8 |
3,109 |
27.9 |
18.3 |
34.0 |
17.7 |
0.5 |
0.8 |
29.2 |
70.1 |
| Kåkind |
6.3 |
7,081 |
33.3 |
15.8 |
32.1 |
14.4 |
2.4 |
1.6 |
37.2 |
62.3 |
| Kålland |
4.8 |
5,359 |
25.7 |
17.3 |
27.1 |
26.1 |
1.5 |
0.5 |
27.7 |
70.5 |
| Laske |
2.4 |
2,684 |
15.2 |
26.0 |
41.8 |
13.6 |
1.5 |
0.5 |
17.2 |
81.4 |
| Lidköping |
4.5 |
5,035 |
50.4 |
22.7 |
0.3 |
11.8 |
4.3 |
9.3 |
64.1 |
34.8 |
| Mariestad |
2.8 |
3,199 |
44.7 |
27.3 |
1.1 |
16.8 |
0.8 |
7.2 |
52.6 |
45.2 |
| Skara |
3.1 |
3,487 |
42.5 |
30.3 |
4.1 |
19.1 |
2.4 |
0.8 |
45.7 |
53.4 |
| Skåning |
4.8 |
5,363 |
22.8 |
19.9 |
42.8 |
13.1 |
0.4 |
0.4 |
23.6 |
75.8 |
| Skövde |
5.0 |
5,573 |
44.1 |
30.3 |
4.3 |
14.7 |
0.6 |
4.7 |
49.3 |
49.4 |
| Tidaholm |
2.1 |
2,381 |
66.1 |
12.5 |
0.3 |
10.9 |
5.1 |
4.9 |
76.1 |
23.7 |
| Vadsbo |
20.0 |
22,556 |
39.1 |
16.2 |
30.7 |
11.5 |
0.5 |
1.0 |
40.6 |
58.3 |
| Valle |
2.1 |
2,325 |
42.8 |
16.8 |
25.5 |
12.3 |
0.3 |
0.3 |
43.5 |
54.6 |
| Vartofta |
10.6 |
11,915 |
33.3 |
13.8 |
38.6 |
12.0 |
1.0 |
0.3 |
34.7 |
64.5 |
| Vilske |
2.4 |
2,699 |
16.6 |
25.7 |
46.2 |
8.8 |
0.2 |
0.1 |
16.8 |
80.7 |
| Viste |
4.2 |
4,722 |
17.8 |
33.5 |
31.9 |
13.4 |
0.8 |
2.0 |
20.5 |
78.8 |
| Åse |
2.1 |
2,418 |
32.2 |
18.7 |
36.8 |
10.2 |
0.7 |
0.5 |
33.4 |
65.7 |
| Postal vote |
0.1 |
72 |
|
|
|
|
|
|
|
|
| Total |
3.9 |
112,539 |
34.6 |
20.7 |
26.3 |
14.4 |
1.2 |
1.7 |
37.6 |
61.4 |
| Source: SCB [1] |
| Location |
Share |
Votes |
S |
AV |
B |
FP |
SP |
K |
Left |
Right |
|---|
| Stockholm |
100.0 |
296,091 |
42.1 |
25.7 |
1.0 |
15.5 |
10.1 |
3.1 |
55.4 |
42.2 |
| Total |
10.1 |
296,091 |
42.1 |
25.7 |
1.0 |
15.5 |
10.1 |
3.2 |
55.4 |
42.2 |
| Source: SCB [1] |
| Location |
Share |
Votes |
S |
AV |
B |
FP |
SP |
K |
Left |
Right |
|---|
| Bro-Vätö |
1.2 |
1,549 |
36.7 |
27.1 |
18.4 |
11.1 |
4.7 |
0.2 |
41.6 |
56.6 |
| Danderyd |
12.9 |
16,653 |
47.6 |
18.2 |
1.8 |
15.9 |
11.0 |
3.9 |
62.5 |
36.0 |
| Djursholm |
2.4 |
3,110 |
28.4 |
49.5 |
1.5 |
15.6 |
1.8 |
0.4 |
30.5 |
66.6 |
| Frösåker |
4.1 |
5,291 |
38.5 |
12.8 |
30.5 |
7.0 |
8.1 |
2.0 |
48.6 |
50.3 |
| Frötuna-Länna |
2.2 |
2,899 |
30.2 |
30.3 |
23.9 |
13.3 |
0.7 |
0.2 |
31.1 |
67.4 |
| Färentuna |
2.6 |
3,307 |
50.1 |
7.9 |
24.3 |
10.4 |
5.4 |
1.4 |
56.9 |
42.5 |
| Lidingö |
4.1 |
5,354 |
35.1 |
34.2 |
1.3 |
18.6 |
7.0 |
1.2 |
43.4 |
54.1 |
| Lyhundra |
1.4 |
1,865 |
29.4 |
25.8 |
27.8 |
11.0 |
3.2 |
1.6 |
34.3 |
64.7 |
| Långhundra |
1.3 |
1,728 |
36.5 |
13.5 |
35.7 |
12.4 |
1.4 |
0.4 |
38.4 |
61.6 |
| Norrtälje |
2.1 |
2,721 |
44.8 |
33.7 |
1.1 |
14.7 |
1.7 |
3.1 |
49.5 |
49.5 |
| Närdinghundra |
2.8 |
3,631 |
42.4 |
11.2 |
26.6 |
10.5 |
7.5 |
1.2 |
51.1 |
48.3 |
| Seminghundra |
1.2 |
1,609 |
34.6 |
15.0 |
36.9 |
10.5 |
1.2 |
0.7 |
36.5 |
62.3 |
| Sigtuna |
0.4 |
575 |
43.0 |
28.3 |
2.8 |
21.9 |
3.1 |
0.0 |
46.1 |
53.0 |
| Sjuhundra |
1.7 |
2,257 |
42.8 |
18.9 |
13.9 |
13.6 |
6.2 |
4.1 |
53.1 |
46.3 |
| Sollentuna |
11.2 |
14,540 |
55.1 |
13.5 |
2.9 |
14.6 |
10.6 |
2.1 |
67.8 |
31.0 |
| Sotholm |
6.8 |
8,796 |
50.7 |
11.6 |
14.6 |
11.5 |
9.6 |
1.6 |
62.0 |
37.6 |
| Sundbyberg |
3.5 |
4,483 |
58.5 |
6.7 |
0.5 |
13.3 |
16.0 |
4.1 |
78.7 |
20.5 |
| Svartlösa |
13.2 |
17,093 |
49.3 |
17.2 |
3.0 |
12.4 |
13.3 |
2.8 |
65.5 |
32.6 |
| Södertälje |
6.0 |
7,819 |
54.9 |
20.7 |
0.8 |
10.4 |
11.0 |
1.2 |
67.2 |
31.9 |
| Vallentuna |
2.3 |
3,018 |
47.0 |
13.7 |
16.5 |
10.3 |
10.7 |
0.7 |
58.4 |
40.5 |
| Vaxholm |
0.9 |
1,215 |
39.9 |
20.4 |
5.3 |
26.3 |
6.3 |
0.9 |
47.2 |
52.1 |
| Väddö-Häverö |
3.2 |
4,089 |
35.8 |
17.9 |
16.7 |
10.4 |
15.8 |
1.6 |
53.1 |
45.0 |
| Värmdö |
3.3 |
4,317 |
54.7 |
15.9 |
5.3 |
14.8 |
6.5 |
2.3 |
63.4 |
36.0 |
| Åker |
2.1 |
2,698 |
43.4 |
12.5 |
23.0 |
14.4 |
5.3 |
1.1 |
49.7 |
49.9 |
| Ärlinghundra |
2.2 |
2,882 |
46.5 |
10.1 |
26.9 |
11.7 |
3.7 |
0.8 |
50.9 |
48.7 |
| Öknebo |
3.5 |
4,572 |
53.1 |
16.4 |
7.7 |
9.4 |
11.6 |
1.5 |
66.2 |
33.6 |
| Öregrund |
0.4 |
501 |
36.3 |
30.7 |
1.8 |
25.7 |
5.4 |
0.0 |
41.7 |
58.3 |
| Östhammar |
0.5 |
638 |
39.3 |
33.9 |
3.1 |
21.2 |
1.6 |
0.0 |
40.9 |
58.2 |
| Postal vote |
0.1 |
158 |
|
|
|
|
|
|
|
|
| Total |
4.4 |
129,368 |
46.8 |
18.0 |
9.6 |
13.1 |
9.2 |
2.1 |
58.1 |
40.7 |
| Source:SCB [1] |
| Location |
Share |
Votes |
S |
AV |
B |
FP |
SP |
K |
Left |
Right |
|---|
| Daga |
3.9 |
3,624 |
39.4 |
14.8 |
19.9 |
20.8 |
5.1 |
0.0 |
44.5 |
55.4 |
| Eskilstuna |
21.0 |
19,611 |
70.1 |
11.1 |
1.1 |
11.7 |
5.1 |
0.8 |
75.9 |
23.8 |
| Hölebo |
2.9 |
2,712 |
47.7 |
7.5 |
26.5 |
10.4 |
6.9 |
0.9 |
55.5 |
44.5 |
| Jönåker |
9.6 |
8,936 |
55.1 |
8.6 |
16.6 |
10.7 |
8.6 |
0.4 |
64.1 |
35.9 |
| Katrineholm |
4.5 |
4,215 |
62.3 |
12.6 |
0.9 |
21.2 |
2.3 |
0.6 |
65.3 |
34.7 |
| Mariefred |
0.8 |
777 |
44.0 |
30.8 |
0.8 |
23.3 |
0.9 |
0.3 |
45.2 |
54.8 |
| Nyköping |
6.4 |
5,954 |
56.1 |
23.1 |
0.8 |
12.3 |
6.1 |
1.2 |
63.5 |
36.2 |
| Oppunda |
16.0 |
14,920 |
52.1 |
7.7 |
16.0 |
21.5 |
1.9 |
0.7 |
54.7 |
45.2 |
| Rönö |
5.0 |
4,675 |
45.6 |
9.4 |
26.0 |
15.4 |
2.9 |
0.5 |
49.0 |
50.9 |
| Selebo |
3.0 |
2,820 |
50.6 |
11.5 |
23.5 |
9.8 |
4.3 |
0.4 |
55.2 |
44.7 |
| Strängnäs |
2.8 |
2,588 |
41.4 |
36.0 |
1.7 |
18.8 |
0.4 |
0.6 |
42.4 |
56.5 |
| Torshälla |
1.1 |
1,054 |
64.0 |
16.4 |
3.9 |
11.6 |
3.7 |
0.4 |
68.1 |
31.9 |
| Trosa |
0.5 |
476 |
43.7 |
43.9 |
1.3 |
9.9 |
1.1 |
0.2 |
45.0 |
55.0 |
| Villåttinge |
8.4 |
7,794 |
52.1 |
11.1 |
15.6 |
15.1 |
5.4 |
0.5 |
58.0 |
41.8 |
| Västerrekarne |
4.3 |
3,979 |
47.6 |
7.2 |
23.7 |
18.7 |
2.6 |
0.1 |
50.3 |
49.7 |
| Åker |
3.9 |
3,619 |
57.0 |
8.8 |
19.1 |
12.0 |
2.7 |
0.1 |
59.9 |
39.8 |
| Österrekarne |
5.9 |
5,526 |
52.5 |
8.9 |
19.9 |
16.7 |
1.5 |
0.3 |
54.3 |
45.6 |
| Postal vote |
0.0 |
30 |
|
|
|
|
|
|
|
|
| Total |
3.2 |
93,310 |
55.6 |
11.8 |
12.4 |
15.2 |
4.2 |
0.6 |
60.4 |
39.4 |
| Source: SCB [1] |
| Location |
Share |
Votes |
S |
AV |
B |
FP |
SP |
K |
Left |
Right |
|---|
| Bro |
2.1 |
1,323 |
57.6 |
13.0 |
17.5 |
6.6 |
4.7 |
0.2 |
62.4 |
37.0 |
| Bälinge |
2.5 |
1,618 |
19.7 |
10.1 |
46.3 |
12.4 |
10.8 |
0.4 |
30.8 |
68.7 |
| Enköping |
4.6 |
2,981 |
49.8 |
26.1 |
2.3 |
16.1 |
3.5 |
0.9 |
54.1 |
44.5 |
| Hagunda |
3.2 |
2,063 |
36.0 |
11.3 |
34.5 |
12.6 |
4.2 |
0.9 |
41.1 |
58.4 |
| Håbo |
2.9 |
1,841 |
52.4 |
19.5 |
15.2 |
9.1 |
3.4 |
0.0 |
55.8 |
43.7 |
| Lagunda |
2.6 |
1,654 |
38.2 |
11.5 |
35.1 |
12.9 |
1.3 |
0.0 |
39.5 |
59.5 |
| Norunda |
3.8 |
2,442 |
24.7 |
10.0 |
29.7 |
21.0 |
14.0 |
0.3 |
39.1 |
60.8 |
| Oland |
13.9 |
8,918 |
33.3 |
7.4 |
25.4 |
19.4 |
13.6 |
0.8 |
47.7 |
52.2 |
| Rasbo |
2.5 |
1,580 |
39.2 |
9.8 |
27.9 |
14.8 |
8.1 |
0.1 |
47.3 |
52.5 |
| Trögd |
5.2 |
3,369 |
39.1 |
13.7 |
35.3 |
8.7 |
2.9 |
0.1 |
42.1 |
57.7 |
| Ulleråker |
5.0 |
3,245 |
43.5 |
10.4 |
14.9 |
15.0 |
14.4 |
0.5 |
58.4 |
40.3 |
| Uppsala |
26.7 |
17,182 |
41.6 |
26.4 |
1.3 |
19.3 |
10.0 |
0.7 |
52.3 |
47.0 |
| Vaksala |
3.3 |
2,128 |
42.7 |
11.7 |
22.7 |
11.0 |
9.5 |
1.1 |
53.3 |
45.3 |
| Åsunda |
3.2 |
2,040 |
33.9 |
13.7 |
43.0 |
5.4 |
3.1 |
0.1 |
37.2 |
62.1 |
| Örbyhus |
18.5 |
11,923 |
58.5 |
5.5 |
15.4 |
11.8 |
8.4 |
0.4 |
67.3 |
32.7 |
| Postal vote |
0.1 |
40 |
|
|
|
|
|
|
|
|
| Total |
2.2 |
64,347 |
42.8 |
14.8 |
17.3 |
15.1 |
9.0 |
0.5 |
52.3 |
47.2 |
| Source: SCB [1] |
| Location |
Share |
Votes |
S |
AV |
B |
FP |
SP |
K |
Left |
Right |
|---|
| Arvika |
2.9 |
3,763 |
43.3 |
16.1 |
0.2 |
20.8 |
12.9 |
4.4 |
60.6 |
37.1 |
| Filipstad |
1.9 |
2,484 |
48.3 |
20.8 |
0.7 |
19.0 |
2.2 |
5.8 |
56.3 |
40.5 |
| Fryksdal |
11.5 |
14,646 |
37.0 |
14.8 |
20.8 |
15.0 |
6.1 |
4.8 |
48.0 |
50.6 |
| Färnebo |
6.8 |
8,671 |
66.8 |
6.1 |
3.0 |
8.4 |
9.8 |
5.6 |
82.2 |
17.4 |
| Gillberg |
4.7 |
6,022 |
45.5 |
11.3 |
19.0 |
13.1 |
9.6 |
1.0 |
56.1 |
43.4 |
| Grums |
4.3 |
5,494 |
57.3 |
6.4 |
17.0 |
7.8 |
5.5 |
5.8 |
68.6 |
31.2 |
| Jösse |
9.5 |
12,205 |
45.7 |
12.3 |
13.6 |
15.8 |
8.4 |
3.2 |
57.3 |
41.7 |
| Karlstad |
9.7 |
12,394 |
48.0 |
19.7 |
1.0 |
17.1 |
9.2 |
2.6 |
59.8 |
37.8 |
| Karlstad Hundred |
4.9 |
6,325 |
62.5 |
8.0 |
5.9 |
9.7 |
10.0 |
3.6 |
76.1 |
23.5 |
| Kil |
7.6 |
9,655 |
49.8 |
7.1 |
15.8 |
13.0 |
12.9 |
0.9 |
63.5 |
36.0 |
| Kristinehamn |
5.1 |
6,582 |
58.7 |
16.2 |
0.1 |
18.4 |
4.6 |
0.8 |
64.1 |
34.7 |
| Nordmark |
6.2 |
7,867 |
33.2 |
12.9 |
22.6 |
23.6 |
4.8 |
1.9 |
39.9 |
59.1 |
| Nyed |
2.2 |
2,812 |
43.7 |
10.9 |
22.7 |
15.6 |
3.4 |
2.2 |
49.3 |
49.3 |
| Näs |
5.2 |
6,639 |
35.3 |
13.3 |
28.0 |
10.4 |
9.1 |
1.7 |
46.1 |
51.7 |
| Visnum |
2.5 |
3,146 |
40.7 |
7.6 |
23.5 |
14.9 |
8.5 |
2.7 |
51.8 |
46.0 |
| Väse |
2.7 |
3,431 |
37.8 |
9.1 |
28.7 |
20.1 |
2.0 |
1.5 |
41.3 |
57.8 |
| Älvdal |
10.9 |
13,932 |
52.6 |
7.1 |
5.7 |
8.5 |
14.0 |
11.1 |
77.7 |
21.3 |
| Ölme |
1.4 |
1,739 |
46.6 |
12.5 |
19.4 |
18.6 |
1.6 |
0.2 |
48.4 |
50.5 |
| Postal vote |
0.0 |
41 |
|
|
|
|
|
|
|
|
| Total |
4.4 |
127,848 |
47.7 |
11.8 |
12.7 |
14.2 |
8.5 |
3.9 |
60.1 |
38.7 |
| Source: SCB [1] |
| Location |
Share |
Votes |
S |
AV |
B |
FP |
SP |
K |
Left |
Right |
|---|
| Burträsk |
4.7 |
4,040 |
22.2 |
29.1 |
16.2 |
31.4 |
0.2 |
0.3 |
22.6 |
76.6 |
| Degerfors |
5.0 |
4,354 |
36.8 |
18.2 |
3.9 |
40.5 |
0.3 |
0.2 |
37.3 |
62.6 |
| Lycksele |
11.3 |
9,837 |
36.9 |
15.6 |
2.4 |
42.0 |
0.6 |
2.4 |
39.8 |
59.9 |
| Nordmaling-Bjurholm |
9.8 |
8,484 |
39.6 |
17.6 |
14.8 |
26.1 |
0.2 |
0.3 |
40.0 |
58.5 |
| Norsjö-Malå |
4.9 |
4,282 |
37.6 |
15.0 |
1.4 |
40.3 |
1.8 |
2.3 |
41.6 |
56.7 |
| Nysätra |
8.4 |
7,288 |
28.7 |
21.6 |
17.5 |
30.7 |
0.5 |
0.2 |
29.4 |
69.9 |
| Skellefteå |
4.0 |
3,485 |
47.0 |
28.0 |
1.3 |
15.9 |
0.8 |
5.2 |
53.0 |
45.1 |
| Skellefteå ting |
20.7 |
17,992 |
40.0 |
24.6 |
10.3 |
21.2 |
0.4 |
3.3 |
43.7 |
56.1 |
| Umeå |
6.0 |
5,253 |
43.7 |
29.9 |
1.4 |
20.3 |
0.2 |
0.9 |
44.8 |
51.6 |
| Umeå ting |
14.8 |
12,827 |
36.6 |
14.7 |
16.9 |
27.8 |
2.1 |
1.5 |
40.2 |
59.4 |
| Vilhelmina |
6.8 |
5,896 |
55.4 |
6.5 |
7.0 |
26.8 |
1.1 |
2.7 |
59.3 |
40.3 |
| Åsele |
3.5 |
3,003 |
49.0 |
8.7 |
10.0 |
29.1 |
0.6 |
0.6 |
50.2 |
47.8 |
| Postal vote |
0.1 |
88 |
|
|
|
|
|
|
|
|
| Total |
3.0 |
86,829 |
38.9 |
19.3 |
9.8 |
28.6 |
0.8 |
1.8 |
41.5 |
57.6 |
| Source: SCB [1] |
| Location |
Share |
Votes |
S |
AV |
B |
FP |
SP |
K |
Left |
Right |
|---|
| Boteå |
5.5 |
6,998 |
62.1 |
8.4 |
14.8 |
3.0 |
6.5 |
4.8 |
73.4 |
26.3 |
| Fjällsjö |
4.1 |
5,154 |
56.5 |
10.7 |
19.0 |
2.6 |
1.8 |
8.9 |
67.2 |
32.2 |
| Härnösand |
4.4 |
5,616 |
45.2 |
32.0 |
0.9 |
12.8 |
2.0 |
3.2 |
50.5 |
45.7 |
| Medelpad Västra |
12.7 |
16,089 |
52.3 |
6.8 |
18.5 |
10.6 |
5.5 |
5.7 |
63.5 |
35.9 |
| Medelpad Östra |
20.9 |
26,421 |
60.3 |
5.9 |
7.4 |
7.5 |
10.5 |
7.8 |
78.6 |
20.9 |
| Ramsele-Resele |
4.9 |
6,166 |
58.3 |
11.0 |
24.6 |
2.5 |
0.7 |
2.5 |
61.5 |
38.0 |
| Sollefteå |
1.0 |
1,305 |
40.8 |
40.9 |
6.3 |
8.5 |
0.1 |
0.5 |
41.5 |
55.7 |
| Sollefteå ting |
4.0 |
5,039 |
65.4 |
10.4 |
14.0 |
2.1 |
0.5 |
6.5 |
72.5 |
26.5 |
| Sundsvall |
6.6 |
8,346 |
41.9 |
33.5 |
1.2 |
13.5 |
4.7 |
2.2 |
48.8 |
48.2 |
| Ångermanland Norra |
16.6 |
21,000 |
50.9 |
14.0 |
16.9 |
14.8 |
0.7 |
2.3 |
53.9 |
45.6 |
| Ångermanland Södra |
17.2 |
21,748 |
52.8 |
8.4 |
17.0 |
7.1 |
4.1 |
10.1 |
67.0 |
32.5 |
| Örnsköldsvik |
2.0 |
2,572 |
40.6 |
32.7 |
1.2 |
21.0 |
0.7 |
2.2 |
43.4 |
54.9 |
| Postal vote |
0.2 |
190 |
|
|
|
|
|
|
|
|
| Total |
4.3 |
126,644 |
54.0 |
12.5 |
13.2 |
9.0 |
4.6 |
5.8 |
64.4 |
34.7 |
| Source: SCB [1] |
| Location |
Share |
Votes |
S |
AV |
B |
FP |
SP |
K |
Left |
Right |
|---|
| Arboga |
3.1 |
2,404 |
58.3 |
21.8 |
1.2 |
16.8 |
1.7 |
0.1 |
60.1 |
39.9 |
| Gamla Norberg |
10.3 |
8,023 |
66.4 |
9.1 |
6.5 |
8.6 |
8.6 |
0.7 |
75.8 |
24.2 |
| Köping |
4.5 |
3,514 |
56.4 |
15.1 |
7.6 |
14.9 |
4.4 |
1.7 |
62.5 |
37.5 |
| Norrbo |
3.7 |
2,871 |
59.6 |
3.7 |
26.4 |
9.2 |
0.7 |
0.5 |
60.7 |
39.3 |
| Sala |
5.0 |
3,912 |
43.1 |
22.1 |
6.3 |
15.8 |
8.9 |
3.8 |
55.8 |
44.2 |
| Siende |
3.3 |
2,611 |
62.4 |
5.0 |
15.7 |
10.8 |
3.8 |
1.2 |
67.4 |
32.6 |
| Simtuna |
5.5 |
4,301 |
35.9 |
11.0 |
33.5 |
13.9 |
3.3 |
2.3 |
41.5 |
58.5 |
| Skinnskatteberg |
3.4 |
2,666 |
61.2 |
5.9 |
9.8 |
9.9 |
7.5 |
5.8 |
74.5 |
25.5 |
| Snevringe |
12.8 |
10,000 |
64.0 |
5.8 |
13.9 |
8.8 |
2.9 |
4.5 |
71.5 |
28.5 |
| Torstuna |
2.7 |
2,118 |
32.0 |
13.7 |
25.1 |
12.8 |
9.5 |
6.9 |
48.4 |
51.6 |
| Tuhundra |
1.4 |
1,111 |
47.9 |
2.7 |
35.0 |
11.4 |
2.4 |
0.5 |
50.9 |
49.1 |
| Vagnsbro |
2.1 |
1,602 |
30.2 |
1.8 |
47.6 |
19.9 |
0.1 |
0.5 |
30.8 |
69.2 |
| Våla |
4.9 |
3,802 |
28.6 |
5.3 |
32.5 |
25.3 |
7.4 |
0.9 |
36.9 |
63.1 |
| Västerås |
21.3 |
16,582 |
62.0 |
15.9 |
1.2 |
16.1 |
2.4 |
2.5 |
66.8 |
33.2 |
| Yttertjurbo |
1.5 |
1,151 |
43.5 |
5.7 |
37.2 |
11.4 |
0.7 |
1.5 |
45.7 |
54.3 |
| Åkerbo |
10.5 |
8,192 |
54.0 |
6.7 |
22.6 |
10.8 |
4.5 |
1.4 |
59.9 |
40.1 |
| Övertjurbo |
3.9 |
3,075 |
30.4 |
5.8 |
48.8 |
12.3 |
2.2 |
0.4 |
33.0 |
67.0 |
| Postal vote |
0.1 |
44 |
|
|
|
|
|
|
|
|
| Total |
2.7 |
77,979 |
54.2 |
10.4 |
15.7 |
13.1 |
4.3 |
2.3 |
60.7 |
39.3 |
| Source: SCB [1] |
| Location |
Share |
Votes |
S |
AV |
B |
FP |
SP |
K |
Left |
Right |
|---|
| Ale |
8.5 |
6,585 |
46.5 |
11.9 |
29.6 |
7.9 |
0.1 |
3.4 |
49.9 |
49.4 |
| Alingsås |
5.1 |
3,956 |
50.0 |
22.2 |
0.6 |
21.5 |
2.9 |
1.0 |
53.9 |
44.2 |
| Bjärke |
2.7 |
2,064 |
22.5 |
20.9 |
22.4 |
32.3 |
0.0 |
1.4 |
23.9 |
75.6 |
| Flundre |
4.3 |
3,347 |
61.4 |
10.0 |
18.9 |
4.6 |
0.1 |
4.6 |
66.2 |
33.5 |
| Gäsene |
5.4 |
4,203 |
11.6 |
34.7 |
33.7 |
17.4 |
1.6 |
0.0 |
13.2 |
85.8 |
| Kulling |
9.5 |
7,368 |
23.9 |
22.4 |
21.9 |
29.9 |
0.5 |
0.4 |
24.9 |
74.2 |
| Nordal |
5.7 |
4,464 |
40.3 |
13.6 |
33.6 |
9.7 |
1.4 |
0.1 |
41.8 |
56.9 |
| Sundal |
6.7 |
5,207 |
13.5 |
20.0 |
59.6 |
5.8 |
0.4 |
0.0 |
14.0 |
85.3 |
| Trollhättan |
8.2 |
6,388 |
72.2 |
13.1 |
0.7 |
9.7 |
2.6 |
1.3 |
76.2 |
23.5 |
| Tössbo |
3.7 |
2,848 |
34.5 |
16.1 |
31.7 |
12.1 |
4.0 |
0.6 |
39.1 |
60.0 |
| Valbo |
5.6 |
4,362 |
33.4 |
21.3 |
38.7 |
5.0 |
0.3 |
0.0 |
33.6 |
65.0 |
| Vedbo |
11.4 |
8,847 |
43.4 |
9.1 |
24.7 |
16.6 |
3.6 |
2.1 |
49.1 |
50.4 |
| Väne |
7.4 |
5,738 |
54.6 |
11.0 |
19.9 |
9.3 |
1.7 |
3.1 |
59.4 |
40.2 |
| Vänersborg |
5.1 |
3,940 |
50.2 |
28.6 |
0.8 |
12.8 |
4.6 |
0.8 |
55.5 |
42.1 |
| Vättle |
6.8 |
5,261 |
44.1 |
19.6 |
13.5 |
16.6 |
1.7 |
3.0 |
48.7 |
49.8 |
| Åmål |
4.1 |
3,207 |
56.8 |
23.9 |
0.6 |
13.8 |
2.6 |
0.6 |
60.1 |
38.4 |
| Postal vote |
0.0 |
38 |
|
|
|
|
|
|
|
|
| Total |
2.7 |
77,823 |
41.1 |
17.7 |
22.4 |
14.0 |
1.8 |
1.5 |
45.0 |
54.1 |
| Source: SCB [1] |
| Location |
Share |
Votes |
S |
AV |
B |
FP |
SP |
K |
Left |
Right |
|---|
| Bollebygd |
4.5 |
3,023 |
36.3 |
32.9 |
15.9 |
9.5 |
0.3 |
1.6 |
38.2 |
58.3 |
| Borås |
28.9 |
19,588 |
54.1 |
27.9 |
0.8 |
9.5 |
2.2 |
1.6 |
59.2 |
38.3 |
| Kind |
19.9 |
13,483 |
27.8 |
29.1 |
32.9 |
9.1 |
0.3 |
0.0 |
28.1 |
71.0 |
| Mark |
23.6 |
16,026 |
40.3 |
31.2 |
20.2 |
3.4 |
2.1 |
1.1 |
43.6 |
54.8 |
| Redväg |
7.0 |
4,781 |
14.2 |
20.9 |
43.5 |
17.7 |
0.2 |
0.0 |
14.4 |
82.1 |
| Ulricehamn |
3.5 |
2,371 |
40.5 |
33.5 |
1.5 |
22.9 |
0.9 |
0.0 |
41.4 |
57.9 |
| Veden |
4.7 |
3,211 |
23.5 |
42.5 |
19.9 |
10.2 |
0.6 |
1.3 |
25.3 |
72.7 |
| Ås |
7.8 |
5,323 |
24.8 |
32.3 |
31.4 |
8.7 |
0.7 |
0.0 |
25.5 |
72.3 |
| Postal vote |
0.0 |
21 |
|
|
|
|
|
|
|
|
| Total |
2.3 |
67,827 |
37.8 |
29.9 |
18.8 |
9.0 |
1.5 |
1.0 |
40.4 |
57.7 |
| Source: SCB [1] |
| Location |
Share |
Votes |
S |
AV |
B |
FP |
SP |
K |
Left |
Right |
|---|
| Asker |
3.9 |
4,064 |
37.1 |
10.9 |
21.8 |
28.0 |
1.9 |
0.0 |
39.0 |
60.7 |
| Askersund |
1.2 |
1,196 |
49.5 |
28.4 |
3.3 |
15.8 |
2.3 |
0.2 |
52.0 |
47.6 |
| Edsberg |
5.6 |
5,808 |
48.2 |
7.9 |
18.6 |
19.3 |
4.5 |
1.2 |
53.9 |
45.8 |
| Fellingsbro |
4.7 |
4,836 |
44.6 |
11.6 |
23.8 |
17.1 |
2.3 |
0.3 |
47.2 |
52.6 |
| Glanshammar |
2.7 |
2,760 |
34.9 |
11.9 |
28.0 |
22.3 |
2.6 |
0.1 |
37.6 |
62.2 |
| Grimsten |
3.2 |
3,344 |
55.9 |
7.3 |
11.3 |
15.9 |
5.5 |
3.8 |
65.2 |
34.4 |
| Grythytte-Hällefors |
4.2 |
4,371 |
58.4 |
6.7 |
0.9 |
8.5 |
22.0 |
3.5 |
83.9 |
16.1 |
| Hardemo |
1.0 |
1,018 |
33.9 |
12.9 |
31.2 |
18.3 |
0.3 |
2.3 |
36.4 |
62.4 |
| Karlskoga |
10.2 |
10,636 |
61.2 |
10.5 |
10.4 |
7.4 |
9.4 |
0.7 |
71.3 |
28.3 |
| Kumla |
9.7 |
10,036 |
54.5 |
12.1 |
8.3 |
20.4 |
1.5 |
2.8 |
58.8 |
40.7 |
| Linde-Ramsberg |
5.0 |
5,197 |
46.7 |
7.9 |
27.2 |
9.8 |
8.3 |
0.1 |
55.2 |
44.8 |
| Lindesberg |
2.0 |
2,089 |
41.0 |
25.6 |
1.8 |
21.7 |
8.6 |
0.6 |
50.2 |
49.0 |
| Nora |
1.5 |
1,525 |
41.4 |
29.6 |
1.3 |
16.7 |
8.5 |
1.6 |
51.5 |
47.7 |
| Nora-Hjulsjö |
3.9 |
4,035 |
55.4 |
9.7 |
13.4 |
12.8 |
5.6 |
2.9 |
63.8 |
35.9 |
| Nya Kopparberg |
4.2 |
4,324 |
62.0 |
7.4 |
5.1 |
10.3 |
11.8 |
3.3 |
77.1 |
22.8 |
| Sköllersta |
4.0 |
4,145 |
40.8 |
11.0 |
16.8 |
29.3 |
1.3 |
0.1 |
42.2 |
57.1 |
| Sundbo |
4.0 |
4,165 |
61.2 |
6.2 |
22.8 |
7.4 |
1.5 |
0.8 |
63.5 |
36.4 |
| Örebro |
18.9 |
19,634 |
54.9 |
21.2 |
0.6 |
16.4 |
4.6 |
0.8 |
60.3 |
38.2 |
| Örebro Hundred |
10.4 |
10,765 |
57.3 |
10.5 |
11.6 |
14.2 |
4.7 |
0.7 |
62.6 |
36.4 |
| Postal vote |
0.0 |
38 |
|
|
|
|
|
|
|
|
| Total |
3.6 |
103,986 |
52.7 |
12.7 |
11.4 |
15.6 |
5.7 |
1.3 |
59.6 |
39.8 |
| Source: SCB [1] |
| Location |
Share |
Votes |
S |
AV |
B |
FP |
SP |
K |
Left |
Right |
|---|
| Aska |
4.7 |
7,054 |
62.8 |
11.1 |
10.7 |
7.1 |
3.0 |
3.9 |
69.8 |
29.0 |
| Bankekind |
4.0 |
5,981 |
58.4 |
11.5 |
19.1 |
8.4 |
1.7 |
0.5 |
60.6 |
39.0 |
| Björkekind |
1.2 |
1,829 |
42.4 |
17.2 |
34.1 |
5.4 |
0.1 |
0.1 |
42.5 |
56.6 |
| Boberg |
2.5 |
3,797 |
47.6 |
14.7 |
17.8 |
8.5 |
2.3 |
6.4 |
56.3 |
41.0 |
| Bråbo |
1.7 |
2,613 |
65.5 |
14.8 |
7.8 |
5.8 |
3.1 |
1.6 |
70.1 |
28.4 |
| Dal |
1.3 |
1,921 |
51.0 |
11.7 |
25.7 |
4.1 |
6.9 |
0.1 |
57.9 |
41.5 |
| Finspånga län |
8.6 |
12,883 |
61.7 |
10.7 |
14.9 |
8.5 |
1.4 |
1.1 |
64.2 |
34.0 |
| Gullberg |
2.1 |
3,171 |
57.4 |
10.6 |
20.9 |
5.3 |
1.3 |
3.5 |
62.2 |
36.8 |
| Göstring |
4.3 |
6,523 |
47.7 |
11.0 |
23.2 |
6.7 |
7.2 |
2.6 |
57.5 |
40.9 |
| Hammarkind |
4.7 |
7,088 |
46.3 |
16.9 |
23.0 |
10.0 |
1.7 |
1.2 |
49.2 |
49.8 |
| Hanekind |
2.3 |
3,468 |
53.8 |
18.1 |
19.1 |
7.1 |
0.2 |
1.0 |
54.9 |
44.3 |
| Kinda |
5.3 |
7,940 |
44.3 |
18.2 |
24.6 |
10.5 |
1.1 |
0.4 |
45.8 |
53.3 |
| Linköping |
10.8 |
16,201 |
54.7 |
25.5 |
1.6 |
11.4 |
0.8 |
3.7 |
59.3 |
38.5 |
| Lysing |
2.7 |
4,025 |
39.7 |
15.3 |
33.2 |
9.3 |
1.0 |
0.6 |
41.3 |
57.7 |
| Lösing |
1.6 |
2,369 |
55.1 |
16.0 |
17.7 |
5.5 |
0.6 |
4.9 |
60.7 |
39.1 |
| Memming |
1.7 |
2,531 |
66.0 |
12.8 |
6.4 |
7.1 |
6.4 |
1.2 |
73.5 |
26.2 |
| Mjölby |
2.1 |
3,145 |
63.8 |
16.4 |
3.0 |
10.5 |
3.1 |
0.3 |
67.2 |
29.9 |
| Motala |
2.0 |
2,999 |
46.1 |
30.6 |
1.1 |
16.9 |
1.5 |
2.1 |
49.8 |
48.6 |
| Norrköping |
22.9 |
34,484 |
58.6 |
27.3 |
1.2 |
6.4 |
1.9 |
2.7 |
63.3 |
34.9 |
| Skänninge |
0.6 |
827 |
42.6 |
22.7 |
12.2 |
19.0 |
0.7 |
0.2 |
43.5 |
53.9 |
| Skärkind |
1.5 |
2,313 |
51.7 |
10.5 |
29.9 |
6.2 |
1.0 |
0.6 |
53.3 |
46.6 |
| Söderköping |
0.9 |
1,410 |
47.7 |
30.4 |
3.8 |
17.4 |
0.0 |
0.3 |
48.0 |
51.6 |
| Vadstena |
1.0 |
1,546 |
44.3 |
31.8 |
2.3 |
13.1 |
6.2 |
0.3 |
50.8 |
47.2 |
| Valkebo |
2.2 |
3,366 |
48.3 |
15.1 |
25.5 |
8.4 |
0.4 |
0.3 |
49.0 |
49.0 |
| Vifolka |
2.3 |
3,411 |
49.0 |
14.8 |
23.7 |
7.8 |
0.6 |
2.6 |
52.3 |
46.4 |
| Ydre |
2.2 |
3,338 |
37.7 |
13.2 |
29.6 |
18.0 |
0.4 |
0.0 |
38.1 |
60.8 |
| Åkerbo |
0.9 |
1,386 |
38.2 |
19.6 |
29.1 |
9.5 |
0.0 |
0.6 |
38.8 |
58.2 |
| Östkind |
1.7 |
2,572 |
38.3 |
19.4 |
33.7 |
7.5 |
0.3 |
0.3 |
38.9 |
60.7 |
| Postal vote |
0.1 |
107 |
|
|
|
|
|
|
|
|
| Total |
5.2 |
150,298 |
53.8 |
19.0 |
13.1 |
8.6 |
1.9 |
2.1 |
57.7 |
40.8 |
| Source: SCB [1] |
