York Centre (federal electoral district)
From Wikipedia, the free encyclopedia
Interactive map of riding boundaries from the 2015 federal election | |||
| Federal electoral district | |||
| Legislature | House of Commons | ||
| MP |
Conservative | ||
| District created | 1952 | ||
| First contested | 1953 | ||
| Last contested | 2025 | ||
| District webpage | profile, map | ||
| Demographics | |||
| Population (2021)[1] | 108,307 | ||
| Electors (2015) | 63,682 | ||
| Area (km²)[2] | 37 | ||
| Pop. density (per km²) | 2,927.2 | ||
| Census division | Toronto | ||
| Census subdivision | Toronto (part) | ||
_(2022_redistribution).svg)

York Centre (French: York-Centre) is a federal electoral district in Ontario, Canada, that has been represented in the House of Commons of Canada from 1904 to 1917 and since 1953. It is currently represented by Conservative MP Roman Baber.
The electoral district was previously considered one of the safest Liberal Party seats in Canada, represented by prominent Liberal MPs with national significance such as Toronto's longest serving mayor Art Eggleton and the hockey legend Ken Dryden. However, this changed as the Conservative Party gained ground in the 2000s. The Conservative Party captured it in 2011 and were competitive in the three subsequent elections. It regained the seat in the 2025 election.
As per the 2016 Census, 17.0% of York Centre residents are of Filipino ethnic origin, which is the highest figure among all city of Toronto ridings. At the same time, the York Centre riding has the highest percentage of residents of Russian (9.5%) and Jewish (5.6%) ethnic origins (in the 2011 National Household Survey, 13.6% of York Centre residents had entered a Jewish ethnic origin). The riding has a large Jewish population, currently the fourth-largest in Canada at 14 percent behind Thornhill, Mount Royal and Eglinton—Lawrence.[3]
- According to the 2021 Canadian census[4]
Ethnic groups: 46.9% White, 19.3% Filipino, 8.0% Black, 5.4% Latin American, 4.1% South Asian, 3.7% Southeast Asian, 3.3% Chinese, 2.5% West Asian, 1.6% Korean
Languages: 42.0% English, 9.5% Tagalog, 6.3% Russian, 5.2% Italian, 5.1% Spanish, 2.1% Vietnamese, 1.6% Portuguese, 1.5% Ilocano, 1.4% Korean, 1.3% Mandarin, 1.1% Cantonese, 1.1% Turkish, 1.1% Persian
Religions: 57.3% Christian (36.0% Catholic, 4.4% Christian Orthodox, 1.7% Pentecostal, 15.2% other), 14.3% Jewish, 5.0% Muslim, 2.5% Buddhist, 2.1% Hindu, 18.3% none
Median income: $36,400 (2020)
Average income: $50,440 (2020)
Geography
York Centre consists of the part of the City of Toronto bounded on the north by the northern city limit, and on the east, south and west by a line drawn from the city limit south along Bathurst Street, southeast along the Don River West Branch, southwest and west along Highway 401, north along Jane Street, east along Sheppard Avenue West, northwest along Black Creek, east along Grandravine Drive, and north along Keele Street to the city limit.
It contains the neighbourhoods of Westminster–Branson, Bathurst Manor, Wilson Heights, Downsview, and York University Heights (a small section south of Grandravine Drive, east of Black Creek).
At the approximate centre of the district is Downsview Park, an urban park controlled by the federal government, on former grounds of Canadian Forces Base Toronto.
History
Geographical evolution
York Centre was originally created in 1903 from parts of York East and York West ridings. It was created when the county of York (excluding the city of Toronto) was divided into three ridings: York Centre, York North and York South. The centre riding consisted of the townships of Etobicoke, Markham, Scarborough and Vaughan, and the villages of Markham, Richmond Hill, Weston and Woodbridge. The electoral district was abolished in 1914 when it was redistributed between York East, York South and York West. In 1952, York Centre was re-established with parts of the York North riding.
The new riding consisted initially of the part of the township of North York west of Yonge Street, the part of the township of Vaughan south of Highway Number 7, and the town of Woodbridge.
In 1966, it was redefined to consist of the part of Metropolitan Toronto bounded on the north by the northern limit, and on the west, south and east by a line drawn from that borough limit south along Highway 400, east along Sheppard Avenue West, south along Jane Street, southeast along Exbury Road, east along Calvington Drive, south along Keele Street, east along Highway 401, south along the Canadian National Railway line, east along Lawrence Avenue West, north along the Spadina Expressway, northeast along Highway 401, north along Bathurst Street, east along Sheppard Avenue West, south along Easton Street, east along Cameron Avenue, and north along Yonge Street to the Metro Toronto limit. It is unclear why the name York Centre was retained as the district was now predominantly in the Borough of North York rather than in the Region of York.
In 1976, it was redefined to consist of the part of the Borough of North York bounded on the north by the borough limit, and on the west, south and east by a line drawn from the borough limit south along Highway 400, east along Sheppard Avenue West, south along Keele Street, east along Highway 401, north along Bathurst Street, and northwest along the West Branch of the Don River to the borough limit, hence giving the parts of the original riding that is south of Highway 401 to the newly-created riding of Eglinton—Lawrence.
In 1987, it was redefined to consist of the part of the City of North York bounded on the north by the city limit, and on the east, south and west by a line drawn from the city limit southeast along the Don River West Branch, west along Highway 401, north along Jane Street, east along Grandravine Drive, and north along Black Creek to the northern city limit.
In 1996, it was redefined to consist of the part of the City of North York bounded on the north by the city limit, and on the east, south and west by a line drawn from the city limit south along Dufferin Street, west along Sheppard Avenue West, north along Keele Street, west along Grandravine Drive, south along Jane Street, east along Highway 401, northwest along the Don River West Branch, north along Bathurst Street, east along Drewry Avenue, north along Chelmsford Avenue, west along Greenwin Village Road, and north along Village Gate to the city limit.
In 2003, it was given its current boundaries as described above.
This riding lost territory to Willowdale during the 2012 electoral redistribution.
The riding did not undergo any boundary changes following the 2022 Canadian federal electoral redistribution.
It is proposed that the riding's name be changed to North York as part of Bill C-25 of the 45th Canadian Parliament.[5]
Former boundaries
 1966 to 1976
 1976 to 1987
 1987 to 1996
 1996 to 2003
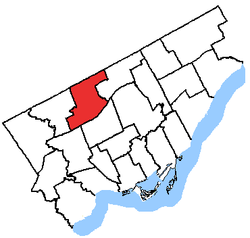 2003 to 2015


Political History
First incarnation, 1904-17
Liberal Archibald Campbell, incumbent MP for York West when the electoral district of York Centre was created, won the first York Centre contest by a margin of 76 votes (out of over 4,000), foreshadowing its future as a swing riding. A veteran of competitive contests, Campbell was first elected in 1887 as MP for Kent in southwestern Ontario by a margin just over 100, an election that was overturned, and was elected in the subsequent by-election with an even smaller margin. He moved to Toronto and sought re-election in York West in 1900, unsuccessfully challenging the six-term MP and former Controller of Customs Nathaniel Clarke Wallace. Campbell was elected MP for York West following Wallace's death, defeating Wallace's son Thomas George Wallace in a by-election, and continued to served as MP for York Centre after redistricting until he was summoned to the Senate in 1907.
Peter Douglas McLean held the seat briefly, fending off the younger Wallace's second attempt at recapturing his father's seat by an even smaller margin of 26 voters in a by-election. The younger Wallace was finally successful on his third try, defeating McLean with a 45 vote margin (out of over 5,000), and continue to serve when the district was reconstitute as York West. Like his father, Thomas Wallace died while in office, in 1921 at age 41.
Recreation as suburban district
In the first election of the reconstituted York Centre in 1953, Liberal candidate Al Hollingworth defeated Roy Thomson, the founder of Canada's wealthiest family and the future 1st Baron Thomson of Fleet, who stood as a Progressive Conservative in his only bid for electoral office. Hollingworth was defeated after one term by Progressive Conservative candidate Fred C. Stinson, the then 34-year old chair of North York's board of education. Stinson was in turn defeated after two terms by James Edgar Walker, who went on to serve five terms, during which he served as Chief Government Whip and Parliamentary Secretary to the Prime Minister.
Launch pad for star candidates
Four of the five Liberals who represented York Centre in the last half century since Walker - Bob Kaplan, Art Eggleton, Ken Dryden, Ya'ara Saks - served in the cabinet (respectively in the Ministries of Trudeau Sr & Turner, Chretien, Martin, Trudeau Jr). Three of them - Eggleton, Dryden and Saks - were named candidates by the leader without facing competitive nomination contests, while Kaplan secured his return to parliament here after having been defeated in Don Valley.
A flank in the Liberal North York bastion
From the 1970s to 1990s, York Centre along with neighbouring York West (now Humber River—Black Creek), York South—Weston and Eglinton—Lawrence were considered among the safest Liberal Party seats in Canada. These electoral districts, located in the western half of the former borough of North York, withheld the Progressive Conservative 1984 landslide and 1988 re-election under Brian Mulroney thanks in no small part to their sizable and fast-growing Jewish Canadian and Italian Canadian communities. York Centre in particular had the highest percentage of Jewish population among Toronto ridings. For much of the second half of the 20th century, these two communities were reliable support base for the Liberals, routinely delivering solid margin for the Liberals both federally and provincially.
The creation of the York Centre provincial electoral district (with identical boundary) in 1999 combined the districts of two Liberal incumbents, the Jewish former minister Monte Kwinter and the Italian former leadership candidate Annamarie Castrilli, triggering one of Ontario Liberal Party's most heavily contested and acrimonious contest nomination for the newly created safe liberal seat.
However, the political leaning of the Jewish Canadian shifted rapidly away from the Liberals and toward the Conservatives in the early 21st century, making York Centre a prime target for Conservative gains. When the Liberal Party suffered its worst defeat in history in 2011, York Centre was among the 16 Toronto seats (out of 22) it lost, despite incumbent MP Ken Dryden, the hockey legend and a former cabinet minister, campaigning exclusively in the riding (he was one of the biggest draw stumping for other candidates in the two previous elections) and hosting the Liberals' final campaign rally, featuring former Prime Minister Jean Chrétien, in the riding.
The Liberals again swept Toronto in the 2015 election and regained York Centre with Michael Levitt. However, Levitt's victory margin of less than 3% was among the tightest for the Liberals in the city. Saks succeed Levitt in 2020 through a by-election[6][7]
A breach in the Liberal Toronto fortress
In the 2025 election that returned the Liberal to power with a minority mandate, Conservative Roman Baber, who represented the district as a Progressive Conservative MPP from 2018 to 2022, secured the only Conservative victory within Toronto city boundary. Baber's election in York Centre is politically significant in the following ways:
- Baber is the first candidate not carrying a Liberal banner elected in Toronto during a general election since the 2011 election (when the Liberal Party suffered its worst defeat in its history, losing most of its Toronto seats including 8 to the Conservatives).
- With the exception of the 8 Conservatives elected in 2011, Baber is the first Conservative MP elected during a general election since the 1988 election.
- In 9 of the past 10 general elections (since 1993 with the exception of 2011), Toronto delivered close to clean sweeps of its approximately 20 seats to the Liberal Party. Baber followed independent MP John Nunziata (who won re-election in 1997 after being expelled from Liberal caucus), former NDP leader Jack Layton (first elected 2004), his spouse and current mayor Olivia Chow and former NDP leadership contender Peggy Nash (both first elected 2006) as the fifth Toronto MP to have successful breached such Liberal sweeps.
Members of Parliament
This riding has elected the following members of Parliament:
| Parliament | Years | Member | Party | |
|---|---|---|---|---|
| York Centre Riding created from York East and York West |
||||
| 10th | 1904–1907 | Archibald Campbell | Liberal | |
| 1907–1908 | Peter Douglas McLean | |||
| 11th | 1908–1911 | Thomas George Wallace | Conservative | |
| 12th | 1911–1917 | |||
| Riding dissolved into York East, York South, and York West | ||||
| Riding re-created from York North | ||||
| 22nd | 1953–1957 | Al Hollingworth | Liberal | |
| 23rd | 1957–1958 | Fred C. Stinson | Progressive Conservative | |
| 24th | 1958–1962 | |||
| 25th | 1962–1963 | James Edgar Walker | Liberal | |
| 26th | 1963–1965 | |||
| 27th | 1965–1968 | |||
| 28th | 1968–1972 | |||
| 29th | 1972–1974 | |||
| 30th | 1974–1979 | Bob Kaplan | ||
| 31st | 1979–1980 | |||
| 32nd | 1980–1984 | |||
| 33rd | 1984–1988 | |||
| 34th | 1988–1993 | |||
| 35th | 1993–1997 | Art Eggleton | ||
| 36th | 1997–2000 | |||
| 37th | 2000–2004 | |||
| 38th | 2004–2006 | Ken Dryden | ||
| 39th | 2006–2008 | |||
| 40th | 2008–2011 | |||
| 41st | 2011–2015 | Mark Adler | Conservative | |
| 42nd | 2015–2019 | Michael Levitt | Liberal | |
| 43rd | 2019–2020 | |||
| 2020–2021 | Ya'ara Saks | |||
| 44th | 2021–2025 | |||
| 45th | 2025–present | Roman Baber | Conservative | |
Election results
View source data.
Graph of election results in York Centre (1953–, minor parties that never got 2% of the vote or didn't run consistently are omitted)
2020–present
| 2025 Canadian federal election | ||||||||
|---|---|---|---|---|---|---|---|---|
| ** Preliminary results — Not yet official ** | ||||||||
| Party | Candidate | Votes | % | ±% | Expenditures | |||
| Conservative | Roman Baber | 26,082 | 54.82 | +16.97 | ||||
| Liberal | Ya'ara Saks | 20,303 | 42.68 | –4.61 | ||||
| New Democratic | Yusuf Ulukanligil | 1,189 | 2.50 | –7.68 | ||||
| Total valid votes/expense limit | ||||||||
| Total rejected ballots | ||||||||
| Turnout | 47,574 | 63.63 | ||||||
| Eligible voters | 74,764 | |||||||
| Conservative gain from Liberal | Swing | +10.79 | ||||||
| Source: Elections Canada[8][9] | ||||||||
| 2021 Canadian federal election | ||||||||
|---|---|---|---|---|---|---|---|---|
| Party | Candidate | Votes | % | ±% | Expenditures | |||
| Liberal | Ya'ara Saks | 17,430 | 47.3 | +1.6 | $106,060.49 | |||
| Conservative | Joel Yakov Etienne | 13,949 | 37.8 | -4.0 | $98,838.17 | |||
| New Democratic | Kemal Ahmed | 3,753 | 10.2 | +4.4 | $5,586.43 | |||
| People's | Nixon Nguyen | 1,726 | 4.7 | +1.1 | $1,816.68 | |||
| Total valid votes/expense limit | 36,858 | 98.6 | – | $106,565.66 | ||||
| Total rejected ballots | 507 | 1.4 | ||||||
| Turnout | 37,365 | 53.4 | ||||||
| Eligible voters | 69,971 | |||||||
| Liberal hold | Swing | +2.8 | ||||||
| Source: Elections Canada[10] | ||||||||
| Canadian federal by-election, October 26, 2020 Resignation of Michael Levitt | ||||||||
|---|---|---|---|---|---|---|---|---|
| Party | Candidate | Votes | % | ±% | Expenditures | |||
| Liberal | Ya'ara Saks | 8,253 | 45.70 | −4.50 | $96,612.31 | |||
| Conservative | Julius Tiangson | 7,552 | 41.82 | +5.11 | ||||
| New Democratic | Andrea Vásquez Jiménez | 1,046 | 5.79 | −4.05 | $2,462.86 | |||
| People's | Maxime Bernier | 642 | 3.56 | – | $27,917.42 | |||
| Green | Sasha Zavarella | 461 | 2.55 | −0.70 | $463.46 | |||
| Independent | John "The Engineer" Turmel | 104 | 0.58 | – | — | |||
| Total valid votes/expense limit | 18,058 | 100.00 | – | $105,734.74 | ||||
| Total rejected ballots | 166 | 0.91 | −0.61 | |||||
| Turnout | 18,224 | 25.64 | −36.12 | |||||
| Eligible voters | 70,434 | |||||||
| Liberal hold | Swing | −4.81 | ||||||
| Source:Elections Canada[11][12] | ||||||||
1953–2019
| 2019 Canadian federal election | ||||||||
|---|---|---|---|---|---|---|---|---|
| Party | Candidate | Votes | % | ±% | Expenditures | |||
| Liberal | Michael Levitt | 21,680 | 50.20 | +3.32 | $93,151.84 | |||
| Conservative | Rachel Willson | 15,852 | 36.71 | −7.29 | $89,344.00 | |||
| New Democratic | Andrea Vásquez Jiménez | 4,251 | 9.84 | +2.51 | none listed | |||
| Green | Rebecca Wood | 1,403 | 3.25 | +1.45 | $0.00 | |||
| Total valid votes/expense limit | 43,186 | 98.48 | ||||||
| Total rejected ballots | 665 | 1.52 | +0.78 | |||||
| Turnout | 43,851 | 61.76 | -3.96 | |||||
| Eligible voters | 71,000 | |||||||
| Liberal hold | Swing | +5.31 | ||||||
| Source: Elections Canada[13][14] | ||||||||
| 2015 Canadian federal election | ||||||||
|---|---|---|---|---|---|---|---|---|
| Party | Candidate | Votes | % | ±% | Expenditures | |||
| Liberal | Michael Levitt | 20,131 | 46.88 | +13.64 | $108,171.17 | |||
| Conservative | Mark Adler | 18,893 | 43.99 | −4.54 | $139,711.85 | |||
| New Democratic | Hal Berman | 3,148 | 7.33 | −8.56 | $9,236.24 | |||
| Green | Constantine Kritsonis | 772 | 1.80 | −0.54 | $2,969.38 | |||
| Total valid votes/expense limit | 42,944 | 99.26 | $198,977.91 | |||||
| Total rejected ballots | 319 | 0.74 | – | |||||
| Turnout | 43,263 | 65.72 | – | |||||
| Eligible voters | 65,832 | |||||||
| Liberal gain from Conservative | Swing | +9.09 | ||||||
| Source: Elections Canada[15][16][17][18] | ||||||||
| 2011 federal election redistributed results[19] | |||
|---|---|---|---|
| Party | Vote | % | |
| Conservative | 17,249 | 48.53 | |
| Liberal | 11,814 | 33.24 | |
| New Democratic | 5,649 | 15.89 | |
| Green | 831 | 2.34 | |
| 2011 Canadian federal election | ||||||||
|---|---|---|---|---|---|---|---|---|
| Party | Candidate | Votes | % | ±% | Expenditures | |||
| Conservative | Mark Adler | 20,356 | 48.5 | +10.5 | $79,794.56 | |||
| Liberal | Ken Dryden | 13,979 | 33.3 | −10.2 | $73,675.98 | |||
| New Democratic | Nick Brownlee | 6,656 | 15.9 | +3.8 | $409.63 | |||
| Green | Rosemary Frei | 979 | 2.3 | −4.1 | $342.41 | |||
| Total valid votes/expense limit | 41,970 | 100.0 | $83,892.08 | |||||
| Total rejected ballots | 350 | 0.1 | – | |||||
| Turnout | 42,320 | 60.3 | +7.6 | |||||
| Eligible voters | 70,216 | – | – | |||||
| Conservative gain from Liberal | Swing | +10.35 | ||||||
| 2008 Canadian federal election | ||||||||
|---|---|---|---|---|---|---|---|---|
| Party | Candidate | Votes | % | ±% | Expenditures | |||
| Liberal | Ken Dryden | 16,164 | 43.5 | −9.2 | $70,386 | |||
| Conservative | Rochelle Wilner | 14,132 | 38.0 | +7.9 | $78,946 | |||
| New Democratic | Kurtis Baily | 4,503 | 12.1 | −1.7 | ||||
| Green | Rosemary Frei | 2,390 | 6.4 | +3.8 | $3,440 | |||
| Total valid votes/expense limit | 37,189 | 100.0 | $81,864 | |||||
| Total rejected ballots | – | |||||||
| Turnout | – | 52.7 | ||||||
| 2006 Canadian federal election | ||||||||
|---|---|---|---|---|---|---|---|---|
| Party | Candidate | Votes | % | ±% | Expenditures | |||
| Liberal | Ken Dryden | 22,439 | 52.7 | −2.1 | $74,395.87 | |||
| Conservative | Michael Mostyn | 12,758 | 30.0 | +3.7 | $69,571.51 | |||
| New Democratic | Marco Iacampo | 5,834 | 13.7 | 0 | $13,721.44 | |||
| Green | Constantine Kritsonis | 1,558 | 3.7 | +0.5 | $1,644.87 | |||
| Total valid votes | 42,589 | |||||||
| 2004 Canadian federal election | ||||||||
|---|---|---|---|---|---|---|---|---|
| Party | Candidate | Votes | % | ±% | Expenditures | |||
| Liberal | Ken Dryden | 21,520 | 54.8 | −16.3 | $64,620 | |||
| Conservative | Michael Mostyn | 10,318 | 26.3 | +5.8 | $72,837 | |||
| New Democratic | Peter Flaherty | 5,376 | 13.7 | +7.7 | $10,017 | |||
| Green | Constantine Kritsonis | 1,240 | 3.2 | +1.7 | ||||
| Independent | Max Royz | 824 | 2.1 | – | $23,589 | |||
| Total valid votes | 39,278 | |||||||
| 2000 Canadian federal election | ||||||||
|---|---|---|---|---|---|---|---|---|
| Party | Candidate | Votes | % | ±% | Expenditures | |||
| Liberal | Art Eggleton | 24,793 | 71.1 | −1.0 | $56,516 | |||
| Alliance | Jeffrey Dorfman | 4,630 | 13.3 | – | $19,703 | |||
| Progressive Conservative | Mark Tweyman | 2,518 | 7.2 | −1.4 | $1,280 | |||
| New Democratic | Maurice Coulter | 2,104 | 6.0 | −3.4 | $8,831 | |||
| Green | Constantine Kritsonis | 532 | 1.5 | +0.5 | $2,401 | |||
| Communist | Christopher Black | 163 | 0.5 | – | $202 | |||
| Marxist–Leninist | Diane Johnston | 142 | 0.4 | 0 | $8 | |||
| Total valid votes | 34,882 | |||||||
| 1997 Canadian federal election | ||||||||
|---|---|---|---|---|---|---|---|---|
| Party | Candidate | Votes | % | ±% | ||||
| Liberal | Art Eggleton | 27,864 | 72.1 | +2.4 | ||||
| New Democratic | Mark Berardo | 3,618 | 9.4 | +5.4 | ||||
| Progressive Conservative | Anthony Figliano | 3,323 | 8.6 | +1.7 | ||||
| Reform | Anthony Chol | 2,876 | 7.4 | +1.9 | ||||
| Green | Constantine Kritsonis | 389 | 1.0 | +0.4 | ||||
| Natural Law | Mike Dubinsky | 242 | 0.6 | 0 | ||||
| Canadian Action | Jozef Izsak | 186 | 0.5 | – | ||||
| Marxist–Leninist | Diane Johnston | 168 | 0.4 | +0.2 | ||||
| Total valid votes | 38,666 | |||||||
| 1993 Canadian federal election | ||||||||
|---|---|---|---|---|---|---|---|---|
| Party | Candidate | Votes | % | ±% | ||||
| Liberal | Art Eggleton | 27,150 | 69.7 | +9.2 | ||||
| Independent | Peter Li Preti | 3,918 | 10.1 | – | ||||
| Progressive Conservative | George Tsiolis | 2,688 | 6.9 | −15.5 | ||||
| Reform | John Beck | 2,141 | 5.5 | – | ||||
| New Democratic | Israel Ellis | 1,557 | 4.0 | −11.4 | ||||
| National | Kurt Loeb | 734 | 1.9 | – | ||||
| Natural Law | Linda Dubé | 253 | 0.6 | – | ||||
| Green | Alan Jones | 216 | 0.6 | – | ||||
| Libertarian | Douglas Quinn | 174 | 0.4 | −1.3 | ||||
| Marxist–Leninist | Diane Johnston | 83 | 0.2 | – | ||||
| Abolitionist | Randy Armour | 60 | 0.2 | – | ||||
| Total valid votes | 38,974 | |||||||
| 1988 Canadian federal election | ||||||||
|---|---|---|---|---|---|---|---|---|
| Party | Candidate | Votes | % | ±% | ||||
| Liberal | Bob Kaplan | 24,962 | 60.5 | +9.3 | ||||
| Progressive Conservative | Rocco Sebastiano | 9,248 | 22.4 | −5.0 | ||||
| New Democratic | Cathy Mele | 6,350 | 15.4 | −4.4 | ||||
| Libertarian | David Kenny | 683 | 1.7 | +1.1 | ||||
| Total valid votes | 41,243 | |||||||
| 1984 Canadian federal election | ||||||||
|---|---|---|---|---|---|---|---|---|
| Party | Candidate | Votes | % | ±% | ||||
| Liberal | Bob Kaplan | 20,810 | 51.2 | -9.8 | ||||
| Progressive Conservative | Mike Cohen | 11,138 | 27.4 | +9.6 | ||||
| New Democratic | Van Newell | 8,037 | 19.8 | −0.5 | ||||
| Libertarian | Simon Srdarev | 244 | 0.6 | −0.1 | ||||
| Independent | Sol Roter | 226 | 0.6 | – | ||||
| Independent | Bonnie J. Geddes | 203 | 0.5 | – | ||||
| Total valid votes | 40,658 | |||||||
| 1980 Canadian federal election | ||||||||
|---|---|---|---|---|---|---|---|---|
| Party | Candidate | Votes | % | ±% | ||||
| Liberal | Bob Kaplan | 23,116 | 61.0 | +9.7 | ||||
| New Democratic | Cris Liscio | 7,696 | 20.3 | −5.4 | ||||
| Progressive Conservative | Anne Silverman | 6,736 | 17.8 | −4.0 | ||||
| Libertarian | Sheldon Gold | 284 | 0.7 | +0.1 | ||||
| Marxist–Leninist | Jeffery Forest | 86 | 0.2 | 0 | ||||
| Total valid votes | 37,918 | |||||||
| 1979 Canadian federal election | ||||||||
|---|---|---|---|---|---|---|---|---|
| Party | Candidate | Votes | % | ±% | ||||
| Liberal | Bob Kaplan | 20,859 | 51.3 | +0.6 | ||||
| New Democratic | Vince Del Buono | 10,464 | 25.7 | +2.2 | ||||
| Progressive Conservative | Bill Schiavono | 8,856 | 21.8 | −3.1 | ||||
| Libertarian | Shannon Vale | 229 | 0.6 | – | ||||
| Independent | Victor Heyn | 97 | 0.2 | – | ||||
| Marxist–Leninist | Jeffery Forest | 81 | 0.2 | 0 | ||||
| Communist | Gerrit van Houten | 63 | 0.2 | 0 | ||||
| Total valid votes | 40,649 | |||||||
| 1974 Canadian federal election | ||||||||
|---|---|---|---|---|---|---|---|---|
| Party | Candidate | Votes | % | ±% | ||||
| Liberal | Bob Kaplan | 32,402 | 50.7 | +8.8 | ||||
| Progressive Conservative | Barry Swadron | 15,877 | 24.9 | −4.9 | ||||
| New Democratic | Michael Copeland | 14,992 | 23.5 | −4.3 | ||||
| Independent | John J. de Niet | 191 | 0.3 | – | ||||
| Social Credit | Roger Drouin | 169 | 0.3 | – | ||||
| Marxist–Leninist | Rick Hundal | 129 | 0.2 | – | ||||
| Communist | Tom Morris | 123 | 0.2 | – | ||||
| Total valid votes | 63,883 | |||||||
| 1972 Canadian federal election | ||||||||
|---|---|---|---|---|---|---|---|---|
| Party | Candidate | Votes | % | ±% | ||||
| Liberal | James E. Walker | 26,912 | 41.9 | −14.7 | ||||
| Progressive Conservative | Barry Swadron | 19,097 | 29.8 | +17.5 | ||||
| New Democratic | Michael Copeland | 17,837 | 27.8 | -3.3 | ||||
| Independent | Harold Sparks | 189 | 0.3 | – | ||||
| Independent | George Paxton | 153 | 0.2 | – | ||||
| Total valid votes | 64,188 | |||||||
| 1968 Canadian federal election | ||||||||
|---|---|---|---|---|---|---|---|---|
| Party | Candidate | Votes | % | ±% | ||||
| Liberal | James E. Walker | 26,758 | 56.6 | +10.2 | ||||
| New Democratic | Douglas Fisher | 14,714 | 31.1 | −5.0 | ||||
| Progressive Conservative | Donald Stirling | 5,804 | 12.3 | −4.8 | ||||
| Total valid votes | 47,276 | |||||||
| 1965 Canadian federal election | ||||||||
|---|---|---|---|---|---|---|---|---|
| Party | Candidate | Votes | % | ±% | ||||
| Liberal | James E. Walker | 41,553 | 46.4 | −3.7 | ||||
| New Democratic | Val Scott | 32,352 | 36.1 | +1.7 | ||||
| Progressive Conservative | Fred C. Stinson | 15,301 | 17.1 | +1.6 | ||||
| Independent | Malcolm Cairnduff | 302 | 0.3 | – | ||||
| Total valid votes | 89,508 | |||||||
| 1963 Canadian federal election | ||||||||
|---|---|---|---|---|---|---|---|---|
| Party | Candidate | Votes | % | ±% | ||||
| Liberal | James E. Walker | 41,485 | 50.1 | +12.0 | ||||
| New Democratic | Val Scott | 28,505 | 34.4 | +0.1 | ||||
| Progressive Conservative | Bill Durovic | 12,807 | 15.5 | −11.2 | ||||
| Total valid votes | 82,797 | |||||||
| 1962 Canadian federal election | ||||||||
|---|---|---|---|---|---|---|---|---|
| Party | Candidate | Votes | % | ±% | ||||
| Liberal | James E. Walker | 30,432 | 38.1 | +5.1 | ||||
| New Democratic | Val Scott | 27,369 | 34.3 | +20.6 | ||||
| Progressive Conservative | Fred C. Stinson | 21,343 | 26.7 | −26.6 | ||||
| Social Credit | David H. Horwood | 746 | 0.9 | – | ||||
| Total valid votes | 79,890 | |||||||
| 1958 Canadian federal election | ||||||||
|---|---|---|---|---|---|---|---|---|
| Party | Candidate | Votes | % | ±% | ||||
| Progressive Conservative | Fred C. Stinson | 30,764 | 53.3 | +5.9 | ||||
| Liberal | Al Hollingworth | 19,065 | 33.0 | −1.4 | ||||
| Co-operative Commonwealth | Larry Sheffe | 7,888 | 13.7 | −2.9 | ||||
| Total valid votes | 57,717 | |||||||
| 1957 Canadian federal election | ||||||||
|---|---|---|---|---|---|---|---|---|
| Party | Candidate | Votes | % | ±% | ||||
| Progressive Conservative | Fred C. Stinson | 23,295 | 47.4 | +11.9 | ||||
| Liberal | Al Hollingworth | 16,925 | 34.4 | −9.7 | ||||
| Co-operative Commonwealth | Roy Begley | 8,164 | 16.6 | −2.3 | ||||
| Social Credit | Rod Gorrill | 777 | 1.6 | – | ||||
| Total valid votes | 49,161 | |||||||
| 1953 Canadian federal election | ||||||||
|---|---|---|---|---|---|---|---|---|
| Party | Candidate | Votes | % | ±% | ||||
| Liberal | Al Hollingworth | 13,903 | 44.1 | – | ||||
| Progressive Conservative | Roy Thomson | 11,180 | 35.5 | – | ||||
| Co-operative Commonwealth | William Newcombe | 5,960 | 18.9 | – | ||||
| Labor–Progressive | David Kashtan | 483 | 1.5 | – | ||||
| Total valid votes | 31,526 | |||||||
1904-1917
View source data.
Graph of election results in York Centre (1903–1914, minor parties that never got 2% of the vote or didn't run consistently are omitted)
| 1911 Canadian federal election | ||||||||
|---|---|---|---|---|---|---|---|---|
| Party | Candidate | Votes | % | ±% | ||||
| Conservative | Thomas George Wallace | 2,838 | 54.9 | +4.5 | ||||
| Liberal | Herbert Hartly Dewart | 2,328 | 45.1 | -4.5 | ||||
| Total valid votes | 5,166 | 100.0 | ||||||
| 1908 Canadian federal election | ||||||||
|---|---|---|---|---|---|---|---|---|
| Party | Candidate | Votes | % | ±% | ||||
| Conservative | Thomas George Wallace | 2,614 | 50.4 | +0.7 | ||||
| Liberal | Peter Douglas McLean | 2,569 | 49.6 | -0.7 | ||||
| Total valid votes | 5,183 | 100.0 | ||||||
| Canadian federal by-election, 23 December 1907 | ||||||||
|---|---|---|---|---|---|---|---|---|
| Party | Candidate | Votes | % | ±% | ||||
| On Mr. Campbell being called to the Senate, 22 November 1907 | ||||||||
| Liberal | Peter Douglas McLean | 2,282 | 50.3 | -0.6 | ||||
| Conservative | T.G. Wallace | 2,256 | 49.7 | +0.6 | ||||
| Total valid votes | 4,538 | 100.0 | ||||||
| 1904 Canadian federal election | ||||||||
|---|---|---|---|---|---|---|---|---|
| Party | Candidate | Votes | % | |||||
| Liberal | Archibald Campbell | 2,222 | 50.9 | |||||
| Conservative | W.H. Pugsley | 2,146 | 49.1 | |||||
| Total valid votes | 4,368 | 100.0 | ||||||